|
<< Click to Display Table of Contents >> Navigation: EQuIS Library > Reports > Standard Reports > Water Levels > Water Level Aggregate vs Location Plot (2d,3d or Bubble) |
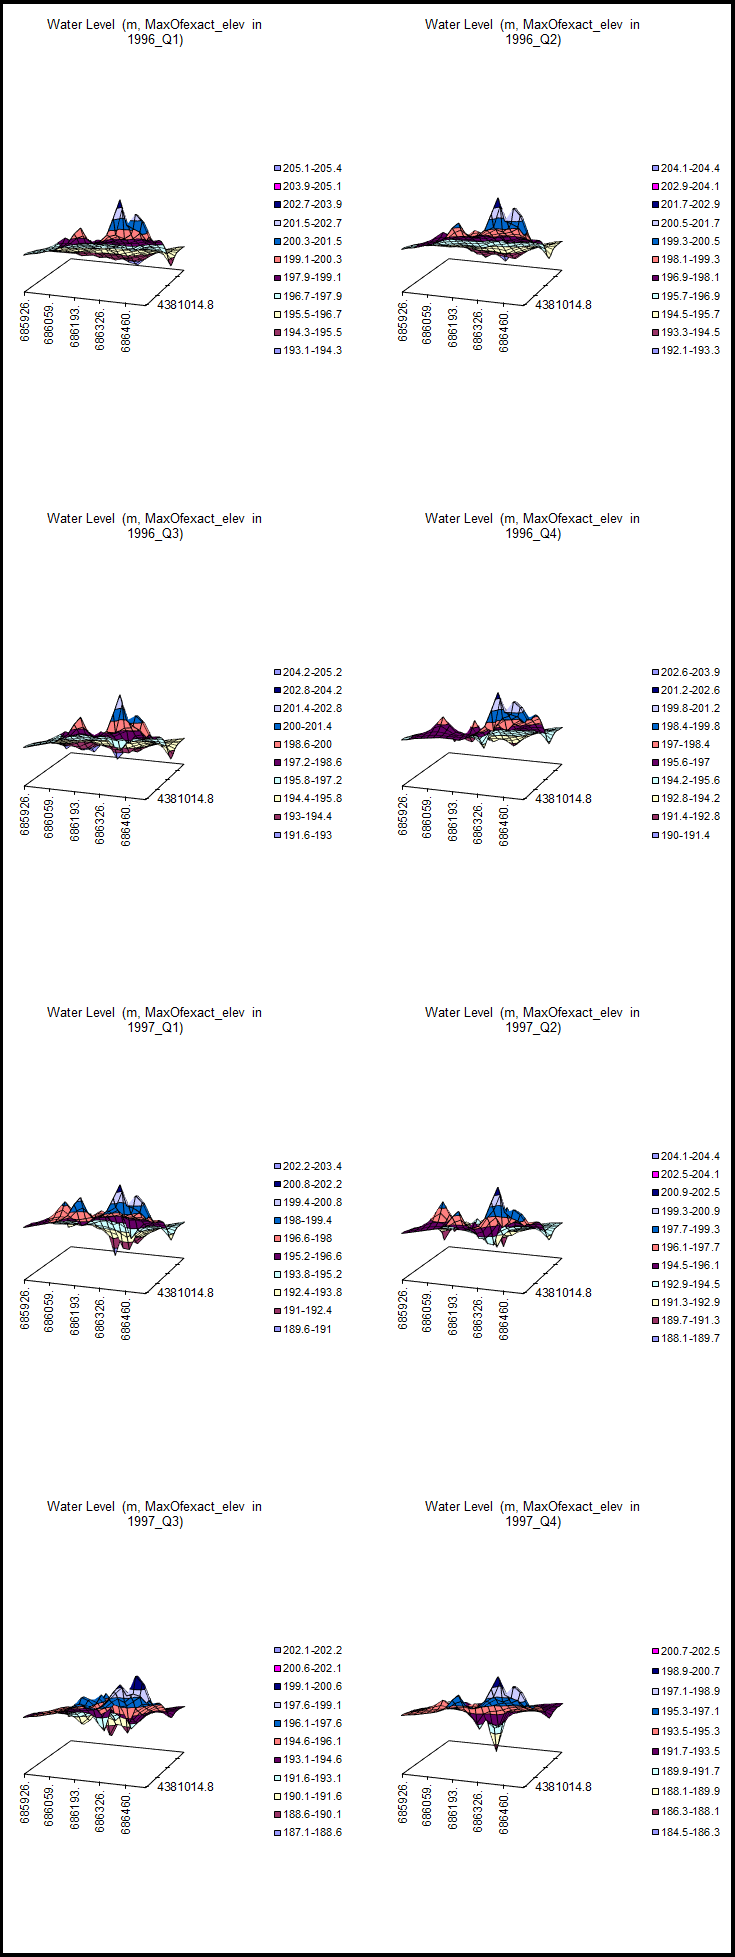
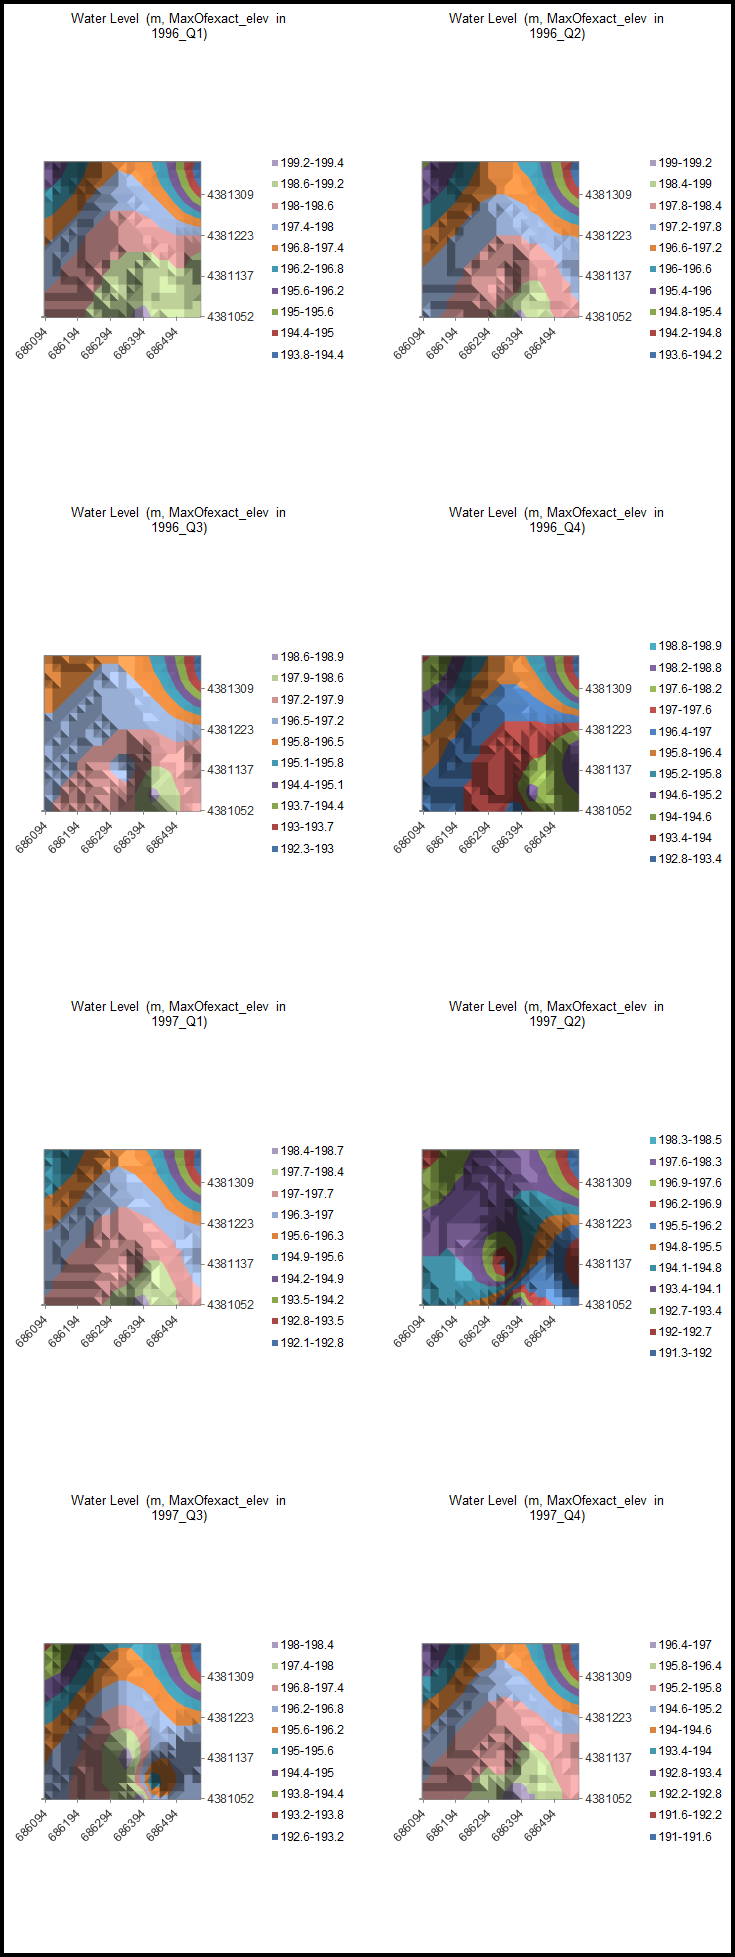
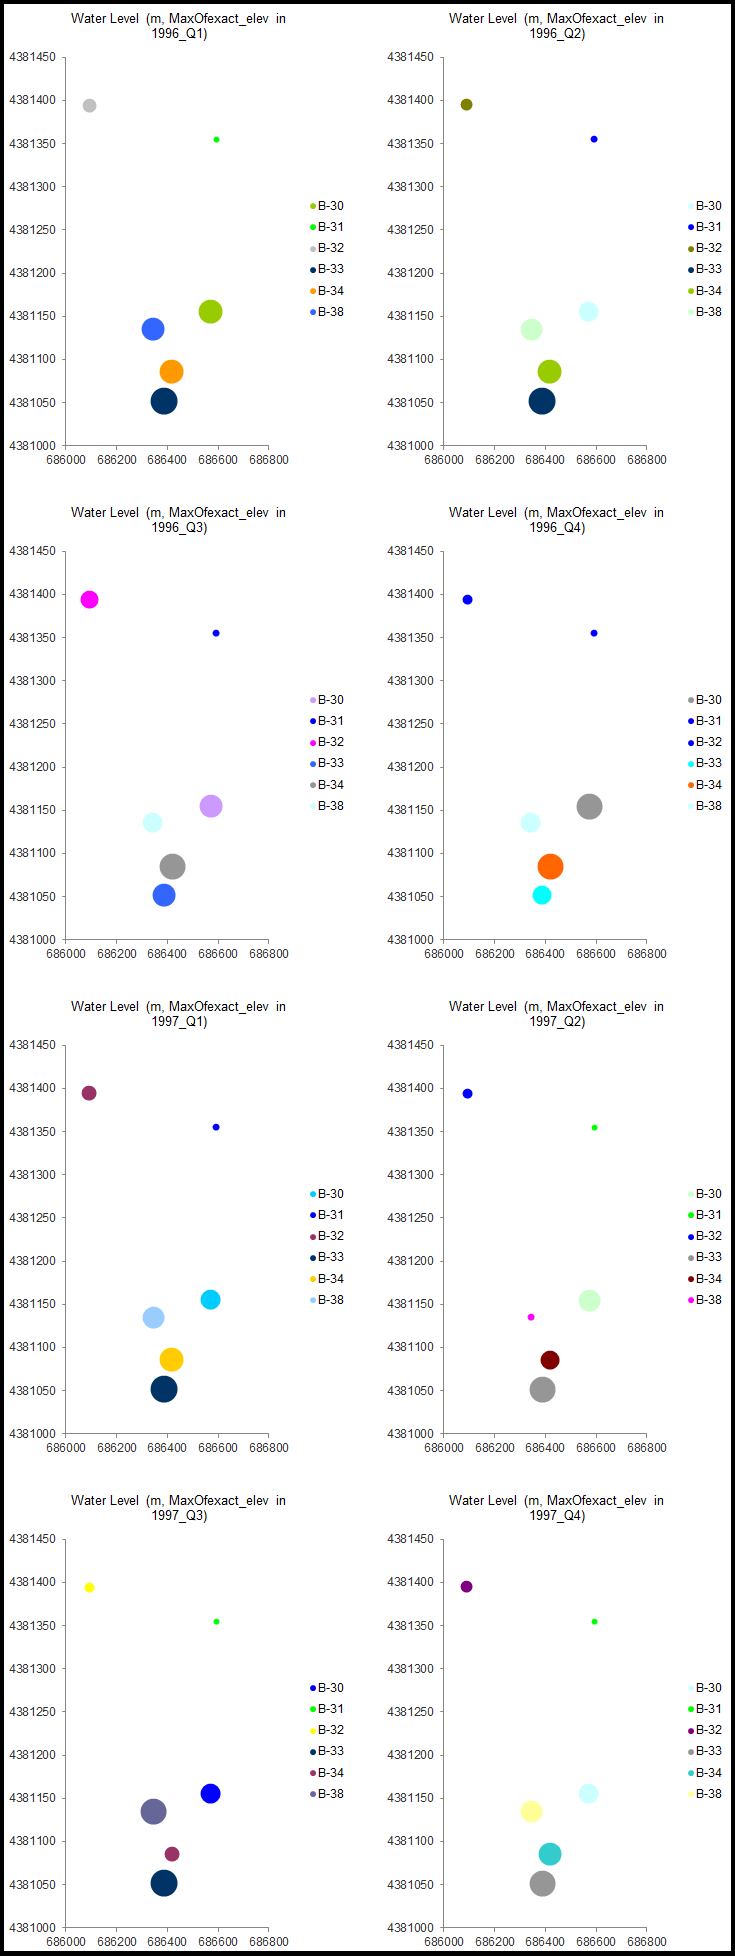
Report Name: Water Level Aggregate Vs. Location Plot (2d, 3d or Bubble) (example: 3D) (example: 2D) (example: bubble)
File Name: EarthSoft.Reports.Library.67849.dll
Dependencies: N/A
Software: EQuIS Professional and EQuIS Enterprise
Source: EQuIS Professional install
Language: English
Output Type: Excel1
Description: The Water Level Aggregate Vs. Location Plot (2d, 3d or Bubble) generates surface 2d contours, surface 3d contours, and bubble charts of an aggregation (max, min, avg or sum) of the water level vs locations. The report relies on the Water Levels Report (EQuIS function/Procedure Report).
Installation Instructions: This report assembly is part of the EQuIS Professional installation. No additional installation steps are necessary.
Overview:
Features include:
•Water level can be aggregated and plotted over different time periods, such as the quarters of the input date range;
•The number of plots per Microsoft Excel print page can be defined as 1, 2, 3, 4, and 6;
•Different units of the water level, when no target unit is entered, are automatically converted to the latest sample unit and any results with failed unit conversions are removed to seamlessly generate plots.
The Water Level Aggregate vs Location Plot (2d, 3d, or bubble) uses the same input parameters as the Water Levels Report, plus chart related parameters as shown below.
This report requires x_coord/y_coord or longitude/latitude of input locations to be populated.
Tables: DT_WATER_LEVEL, DT_WELL, RT_ANALYTE_DETAIL, DT_LOCATION, RT_GROUP, RT_GROUP_MEMBER, VW_LOCATION
Report Parameters * |
||||||||||||||||||||||||||||||||||||||||||||
|---|---|---|---|---|---|---|---|---|---|---|---|---|---|---|---|---|---|---|---|---|---|---|---|---|---|---|---|---|---|---|---|---|---|---|---|---|---|---|---|---|---|---|---|---|
|
||||||||||||||||||||||||||||||||||||||||||||
* This report includes the following hidden parameter(s) that could affect the output of the report: •Label Font Size
Note: This report includes hidden 3D parameters: The number of intervals in Z axis and Add walls.
If listed, the Additional Fields parameter may be customized as explained in How To Customize the Additional Fields Parameter.
Consult an EQuIS administrator if hidden parameters should be visible or use different default values in a published report (a report that allows saving of User Reports). Hidden parameters cannot be viewed or changed in unpublished reports outside of a report parameter file.
|
1Excel report output requires a valid license of Microsoft Excel to view the output.
Copyright © 2026 EarthSoft, Inc. • Modified: 08 Dec 2023