|
<< Click to Display Table of Contents >> Navigation: EQuIS Library > Reports > Standard Reports > Water Levels > MultiWell Time Series Chart |
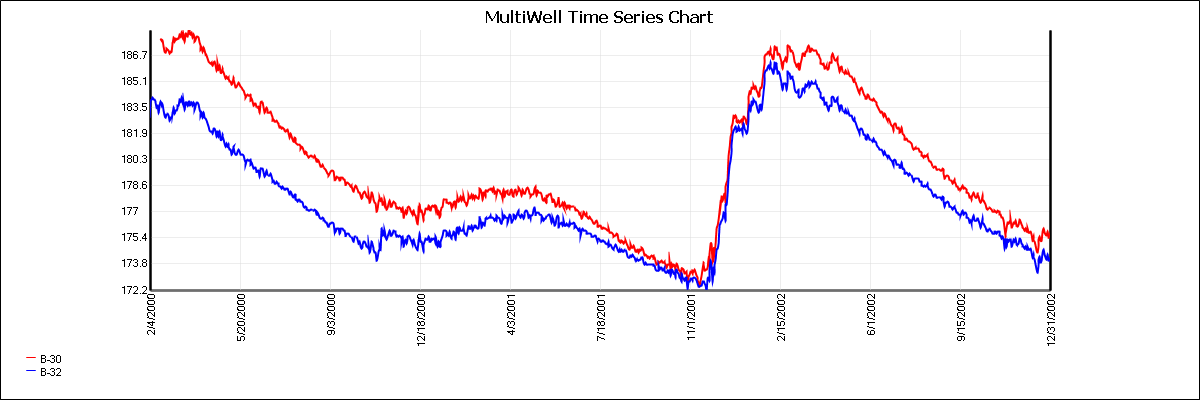
Report Name: MultiWell Time Series Chart (example)
File Name: EarthSoft.Reports.Library.24130.dll
Dependencies: N/A
Software: EQuIS Professional and EQuIS Enterprise
Source: EQuIS Professional install
Language: English
Output Type: Excel1 or *.png
Description: This report lets both Professional and Enterprise users create time series charts using a variety of parameters.
Installation Instructions: This report assembly is part of the EQuIS Professional installation. No additional installation steps are necessary.
Overview:
The user first selects a location and date range (and optionally the header and footer text for the chart). The user may then add up to nine different series to the chart.
For each series, the user selects the following:
•Parameter: (which may be from analytical results, location parameters, or water levels)
•Axis: either Left or Right
•Type: either Line or Bar
•Color: either Black, Blue, Green, Red, or Yellow
The output of this report is a *.png image file containing the specified chart. MultiWell Time Series Chart now exports to Excel and to png files in the same format.
•The MultiWell Time Series Chart Report:
oAllows 9 series to be generated on one graph.
oHas the option of five colors for each series.
•The Multiwell Time Series Chart has the option to export 12 series.
Tables: DT_LOCATION, DT_LOCATION_PARAMETER, DT_RESULT, DT_SAMPLE, DT_SAMPLE_PARAMETER, RT_ANALYTE, RT_LOCATION_PARAM_TYPE, RT_SAMPLE_PARAM_TYPE
Report Parameters |
|||||||||||||||||||||||||||||||||||||||||||
|---|---|---|---|---|---|---|---|---|---|---|---|---|---|---|---|---|---|---|---|---|---|---|---|---|---|---|---|---|---|---|---|---|---|---|---|---|---|---|---|---|---|---|---|
|
Report Output |
|---|
Chart in *.png or in Excel |
1Excel report output requires a valid license of Microsoft Excel to view the output.
Copyright © 2026 EarthSoft, Inc. • Modified: 25 Nov 2021