|
<< Click to Display Table of Contents >> Navigation: EQuIS Library > Reports > Standard Reports > Water Levels > LNAPL Column Report |
Report Name: LNAPL Column (example)
File Name: EarthSoft.Reports.Library.88991.dll
Dependencies: N/A
Software: EQuIS Professional and EQuIS Enterprise
Source: EQuIS Professional install
Language: English
Output Type: Excel1
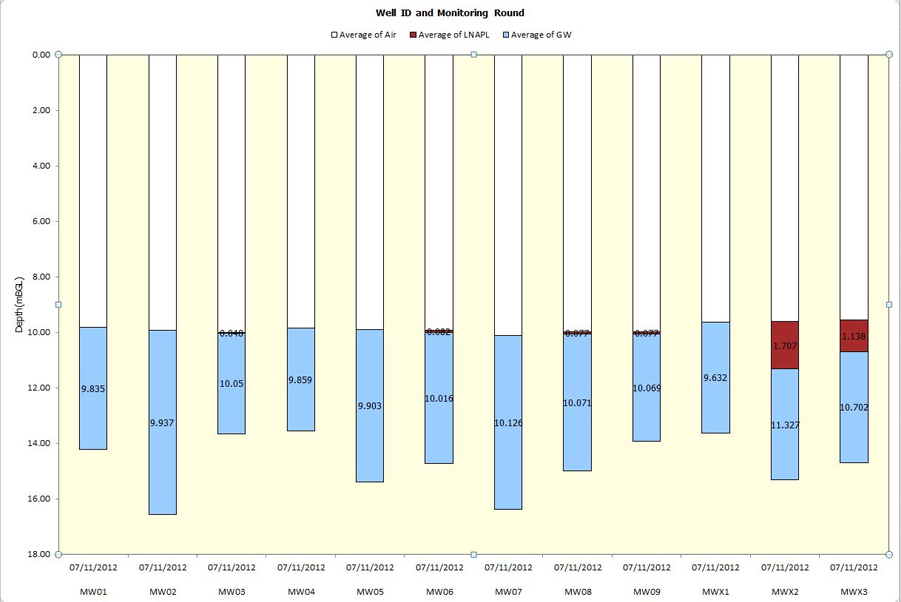
Description: The LNAPL Column Report creates a visual display of daily LNAPL thickness and water levels in the selected wells.
Installation Instructions: This report assembly is part of the EQuIS Professional installation. No additional installation steps are necessary.
Overview:
A series of wells are presented on a single Excel Column chart that displays the depth of air (white), LNAPL (brown), and water (blue). The vertical extent of each column represents the total depth of the well. The locations are organized in both alphanumeric and chronological order. This report requires data in DT_LOCATION.SYS_LOC_CODE, and DT_TASK.TASK_CODE.
The vertical extent of each column are calculated as follows:
•Air (white) = daily average of DT_WATER_LEVEL.LNAPL_DEPTH or WATER_LEVEL_DEPTH in order of priority MultiWell Time Series Chart (24130).
•LNAPL (brown) = daily average of (DT_WATER_LEVEL.WATER_LEVEL_DEPTH - LNAPL_DEPTH). This is annotated with LNAPL_THICKNESS.
•Water (blue) = daily average (DT_WATER_LEVEL. MEASURED_DEPTH_OF_WELL, DT_LOCATION.TOTAL_DEPTH or (DT_WATER_LEVEL.WATER_LEVEL_DEPTH + 4) in order of priority) - DT_WATER_LEVEL.WATER_LEVEL_DEPTH. This is annotated with WATER_LEVEL_DEPTH
Tables: DT_LOCATION, DT_WATER_LEVEL, RT_GROUP, RT_GROUP_MEMBER, DT_TASK
Report Parameters |
||||||||||||||||||||||
|---|---|---|---|---|---|---|---|---|---|---|---|---|---|---|---|---|---|---|---|---|---|---|
|
Report Output |
|---|
The report output is an Excel chart graphically displaying the LNAPL thickness and water level. |
1Excel report output requires a valid license of Microsoft Excel to view the output.
Copyright © 2026 EarthSoft, Inc. • Modified: 12 May 2020