A drop-down button for easy access to EQuIS Google Earth reports is available in the Standard section of the Graphics ribbon in EQuIS Professional.
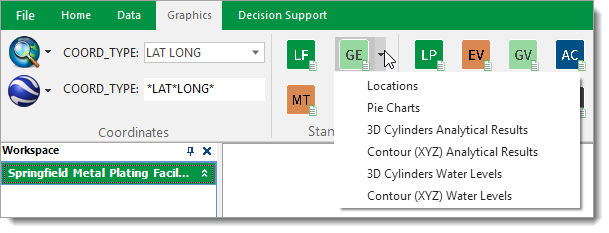
Read more about each report:
•Google Earth Analytical Results (Aggregate) Pie Charts
•Google Earth Analytical Results (3D Cylinders)
•Google Earth: Analytical Results (XYZ Plot)
•Google Earth Water Levels (3D Cylinders)
•Google Earth: Water Levels (XYZ Plot)
Submission of Content Warning
Some of the EarthSoft REST APIs allow the submission of content, and, except as expressly provided in these terms, Google does not acquire any ownership of any intellectual property rights that you or your end users hold in the content that you submit to our APIs through your API Client. By submitting, posting or displaying content to or from the APIs through your API Client, you give Google a perpetual, irrevocable, worldwide, royalty-free, and non-exclusive license to reproduce, adapt, modify, translate, publish, publicly perform, publicly display and distribute such content. However, Google will only use such content for the purpose of enabling Google to provide the APIs, and only in accordance with the applicable Google privacy policies. You agree that this license includes a right for Google to make such content available to other companies, organizations or individuals with whom Google has relationships for the provision of syndicated services, and to use such content in connection with the provision of those services. Before you submit content to our APIs through your API Client, ensure that you have the necessary rights (including the necessary rights from your end users) to grant us the license.
If this is a concern for your usage, avoid using the EQuIS Google Earth-based reports listed below.
•Google Earth - Analytical Results (Aggregate) Pie Charts
•Google Earth - Grain Size Distribution Report (not distributed with EQuIS)
•Map - Analytical Results (Aggregate) Pie Charts (not distributed with EQuIS)
•Google Earth - Analytical Results XY Charts (Concentration Over Time)