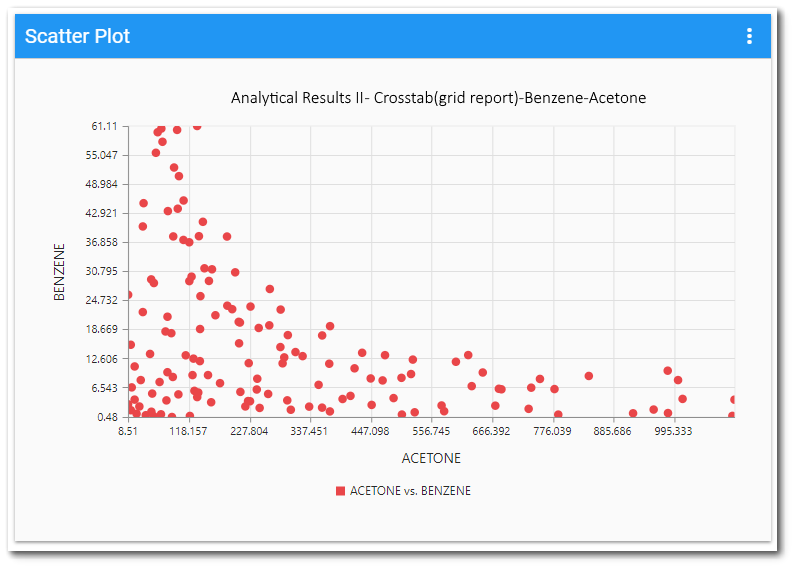
Introduced in Enterprise 7, the Scatter Plot widget plots two different chemicals or parameters on the X- and Y-axis to demonstrate correlations. The input data needed to produce the chart is a set of value pairs saved in a user report.
The report for the widget can be created as follows:
1.Select a base report (e.g., Analytical Result II that only includes two analytes, such as benzene and acetone). Save this as a user report.
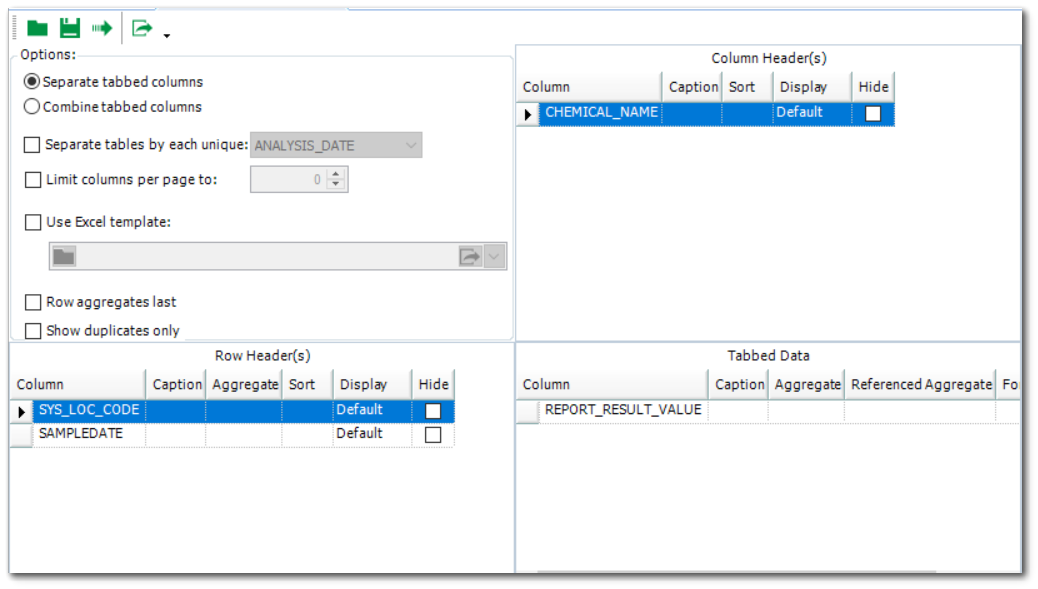
2.Create a crosstab from this report and publish it to the database. Select to Publish as grid report when publishing the Report to the database. The criteria for matching the pair of constituents is determined by how the row header(s) section is populated in the crosstab.
The following is an example of the crosstab layout:
3.In the widget properties, choose the crosstab as the report.
4.Within the Report Parameter Editor select the user report (if you have saved the crosstab to prompt for user report). You may also choose to publish the crosstab for 'show all input parameters'.
5.Save As.
Widget Properties
The properties of the Scatter Plot widget include a report chooser, X-axis drop-down, and Y-axis drop down. To change properties of the Scatter Plot widget, open the Widget Editor by selecting the More Options ![]() icon in the upper right corner of the widget to display the drop-down menu and then select the Edit menu option.
icon in the upper right corner of the widget to display the drop-down menu and then select the Edit menu option.
Widget Title – By default, the widget title is Scatter Plot. The title can be modified.
Widget Description – The description field provides a caption of the widget content for screen readers. This field improves accessibility by allowing visual elements such as charts to be given accessible text descriptions. It also displays a tooltip when hovering on the widget header. Default text (of the widget type's description) is provided but can be edited by users for additional context. This field has a 250-character limit.
Widget Color – The color of the widget can be changed using the Widget Theme![]() icon to the left of the widget title.
icon to the left of the widget title.
Report Chooser – This control is used to select the report to be used with this instance of the Scatter Plot widget. The name of the currently selected report (if applicable) is displayed by default. To select a different report, click the Choose a Report button or name of the report. The Report Chooser will open and display available reports. Select the desired report.
Report Parameters – The report parameters (e.g., facility, sample date range, etc.) can be edited by clicking on the Edit button ![]() to open the Report Parameter Editor for the selected report. A user with editor permission on the selected report may update the report.
to open the Report Parameter Editor for the selected report. A user with editor permission on the selected report may update the report.
X-Axis – Click on the drop-down menu to select the constituent to graph on the X-axis (e.g., benzene).
Y-Axis – Click on the drop-down menu to select the constituent to graph on the Y-axis (e.g., acetone).
Widget Object Editor – To set various appearance properties of the widget, select the Object Editor ![]() icon in the widget header to open the Widget Object Editor. See the Widget Editor article for more details.
icon in the widget header to open the Widget Object Editor. See the Widget Editor article for more details.
Help – The Help ![]() icon connects to the online documentation related to the specific widget.
icon connects to the online documentation related to the specific widget.
Copy Settings – Select the Copy Settings ![]() icon to to copy the settings from another widget of the same type. See the Copy Widget Settings article for more information.
icon to to copy the settings from another widget of the same type. See the Copy Widget Settings article for more information.
Cancel – Select the Close without Saving ![]() icon to exit the Widget Editor without saving changes.
icon to exit the Widget Editor without saving changes.
Save – Changes will be applied to the widget by clicking on the Save ![]() icon. The Widget Editor screen will close after the save operation is complete.
icon. The Widget Editor screen will close after the save operation is complete.