The Map Plot field type allows users to draw points, lines, and polygons in Collect Mobile. Users can also create Geographic Collections comprised of only points, lines, or polygons, or a combination of them. The Map Plot is configured for a form in the Template Designer and can be used in conjunction with the Map Setup property. Using the Map Plot field in conjunction with the Map Setup will allow users to view the GeoJSON layers created by the Map Plot in the Map Form Viewer as reference layers. Using the Map Plot field without configuration of the Map Setup property will create a GeoJSON file but will not be visible in the Map Form Viewer. The GeoJSON files created by the Map Plot can be pushed to the database. Please reference the Data Mapping for Multimedia Data on Collect Forms article for mapping GeoJSON files to the database.
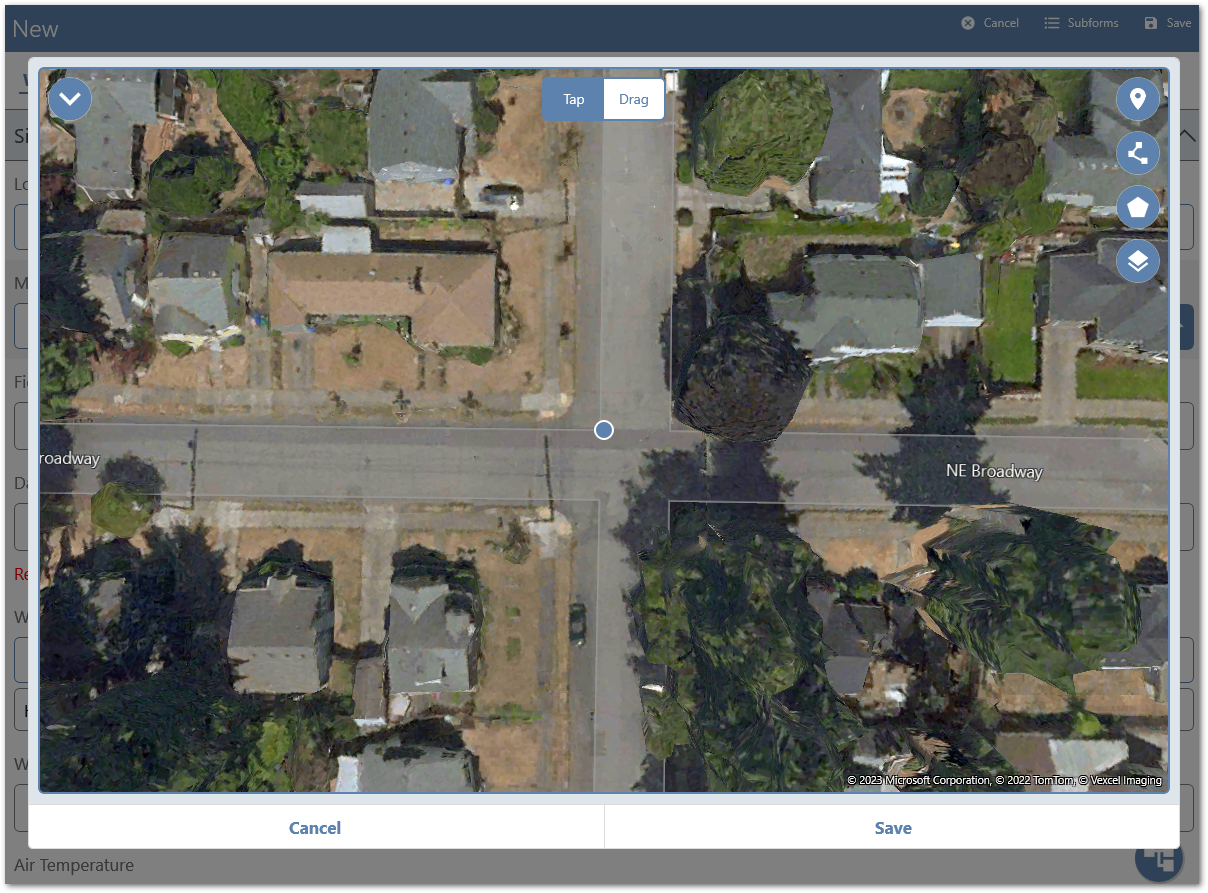
By default, the Map Plot will display a map view centered on the location of the user and their device.
Note: The Map Plot field type requires users to enable location services (i.e., "Let EQuIS Collect access your precise location") when configuring Collect Mobile to utilize full functionality. If location services are not enabled, certain functionality (e.g., using the GPS button or the Interval Timer button) will not work. |
|---|
Map Controls - Left
A drop-down menu in the upper left corner of the map includes several buttons to help visualize the data markers and navigate in the Map Plot.
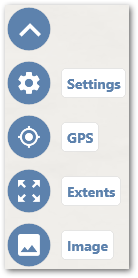
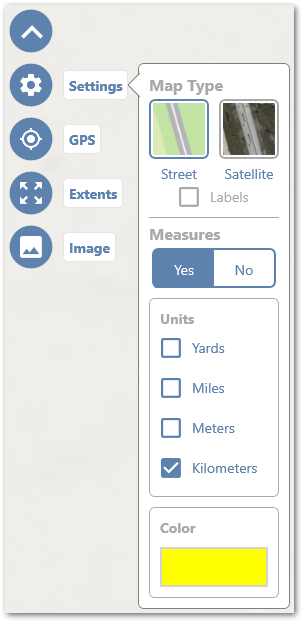
Settings – An expandable menu with options for setting the base map type (e.g., Street of Satellite), if measurements for lines and polygons should be displayed, units of measurement, and the color of text for displaying the measurements.
GPS – Zoom into the user's current GPS (geographical) location.
Extents – Zoom into the area encompassing all the layers currently plotted on the map.
Image – Captures a screen shot of the current extent of the Map Plot and saves the image to the default location for pictures on the device. Downloading an image requires enabling access (i.e., permissions) on the device.
Note: The measurements are strictly a visual reference in Collect Mobile. The values will not be included in the GeoJSON file. If a screen capture that includes the measurements is needed for reference, click the Drag button (described below), select the desired feature to display the measurements, and lastly click the Image button to save the screen capture to the device. |
|---|
Map Controls - Center
Two map control buttons are displayed on the top-center of the map, Tap and Drag, with the selected option shown in blue.
Tap – The Tap button is used to select and edit attributes for the selected feature.
Drag – The Drag button is used to select and move a feature. Selecting a line or polygon will display the Move Vertex icon (i.e., hand icon) at each vertex, allowing users to adjust a line or the boundary of a polygon.
Note: The Tap and Drag buttons are not visible while a feature is being plotted. Once the feature is plotted, click the Close (X) button to collapse the mapping toolbar and Tap and Drag are displayed again. |
|---|
Map Controls - Right
A menu in the upper right corner of the map includes several buttons for plotting points, lines, polygons, and viewing all plotted layers or creating geographic collections. After selecting a feature type to plot, additional options become available to configure feature properties, such as colors and sizes.
|
|

The following buttons (i.e., icons) are displayed depending on if Point, Line, or Polygon is selected:
|
The Plot Feature button is present for point, line, and polygon feature types and indicates that the selected feature is available to plot on the map. |
|
The Interval Timer button is only available for lines and polygons. The timer allows users to automatically plot points on a user set interval. Selecting the Interval Timer displays a small dialog for setting the interval duration (from 1 second to 10 minutes) using the mm:ss format and what failure action the user wants if a point is not plotted as expected . The default setting is "Stop" which automatically ends the plotted line or closes the plotted polygon. The "Continue" option is available and will attempt to continue capturing points as the timer interval continues. |
|
The Close button is used to stop plotting the current feature type on the map and collapse the mapping toolbar. |
|
The End Line button is displayed when a line feature is being plotted and is used to stop plotting the current line. However, the line plotting option remains open and another line can be plotted by clicking on the map at the desired starting location. |
|
The End Polygon button is displayed when a polygon feature is being plotted and is used to stop plotting the current polygon. However, the polygon plotting option remains open and another polygon can be plotted by clicking on the map at the desired starting location. |
|
The Delete button removes one vertex at a time, starting with the most recent, from the line or polygon being plotted. |
Note: There is an Add (+) button available as an option for polygons which is used to create nested polygons. If a nested polygon is created, the inner polygon, or polygons, voids will be created in alternating patterns. For example, there are three nested polygons, Polygon 1 will be displayed, then the Polygon 2 will be a void within Polygon 1, and finally, Polygon 3 will be displayed inside the void caused by Polygon 2. |
|---|
The following buttons are displayed when the Layers/Geographic Collection(s) button is selected:
|
The Reorder Layers button is used to change the order of the layers. |
|
The Edit Layers button is used to edit layer attributes (e.g., change the name of a layer, adjust the width of a line, or change the icon of a point feature). |
|
The Delete button is used to delete a layer or remove a layer from a geographic collection. |
|
The Add button is used to create a Multi Point, Multi Line String, Multi Polygon, or Geometry Collection. |
Notes: •Point features will always be plotted on top of line and polygon features regardless of what order the layers are configured in. •Clicking the Add (+) button to create a "Multi" feature will open a dialog displaying a list of all current layers of the same feature type, and all features that are associated with the "Multi" feature will share attributes (e.g., size, icon, and color). •Geometry collections can be a combination of any feature type(s). •Rearranging the order of overlapping lines and polygons on Universal Windows Platform (UWP) does not work, making it impossible to select a line beneath a polygon using Tap or Drag, only the polygon will be selected. To select a line beneath a polygon, it is necessary to adjust the boundary of the polygon, exposing a portion of the line outside of the polygon, then selecting the line for editing attributes or verticies. |
|---|
Creating Map Features
Points, lines, polygons, and collections are all created from the feature buttons in the top-right corner of the map. Only one feature type (i.e., point, line, or polygon) can be plotted at one time. For any feature type, click the Plot Feature button, or optionally the Interval Timer button if plotting a line or polygon, and begin plotting features on the map. Clicking anywhere inside the box of the cross hair will result in the point being plotted at the center of the cross hair. Each click inside of the cross hair results in one point feature being plotted, or plotting a vertex (i.e., point) for lines and polygons. Lines are completed by selecting the Close button to close the line drawing options or select the End Line button to complete the current line and begin drawing another line. Clicking the Delete button will undo the most recent vertex, one at a time, from the line feature. Polygons are completed by selecting the Close button to close the polygon drawing options or select the End Polygon button to complete the current polygon and begin drawing another polygon. Clicking the Delete button will undo the most recent vertex, one at a time, from the polygon feature. Using the Interval Timer option to plot a line or polygon will plot a vertex at the specified interval. Selecting the Layers/Geographic Collections button displays all existing layers but also enables creating Multi Point, Multi Line Sting, Multi Polygon, and Geographic Collection features by clicking the Add button. Each Multi feature type (i.e., point, line, and polygon) will share the same attributes, such as color, size, icon, or opacity. Geographic Collections can be any combination of points, lines, or polygons, including "Multi" features. For both "Multi" features and Geographic Collections, clicking the Delete button allows users to either delete the feature or ungroup it from the current group.
Notes: •A line or polygon can be started and, with the feature still active, the timer functionality can be initiated. Once the timer starts, it will automatically move to the user's location and continue plotting waypoints from that location at the specified interval. •Using Universal Windows Platform (UWP) for certain locations, 3D imagery is used for the Satellite basemap and features appear "below" the surface of 3D object (e.g., a building). Zooming out will increase the visibility of the plotted feature. |
|---|
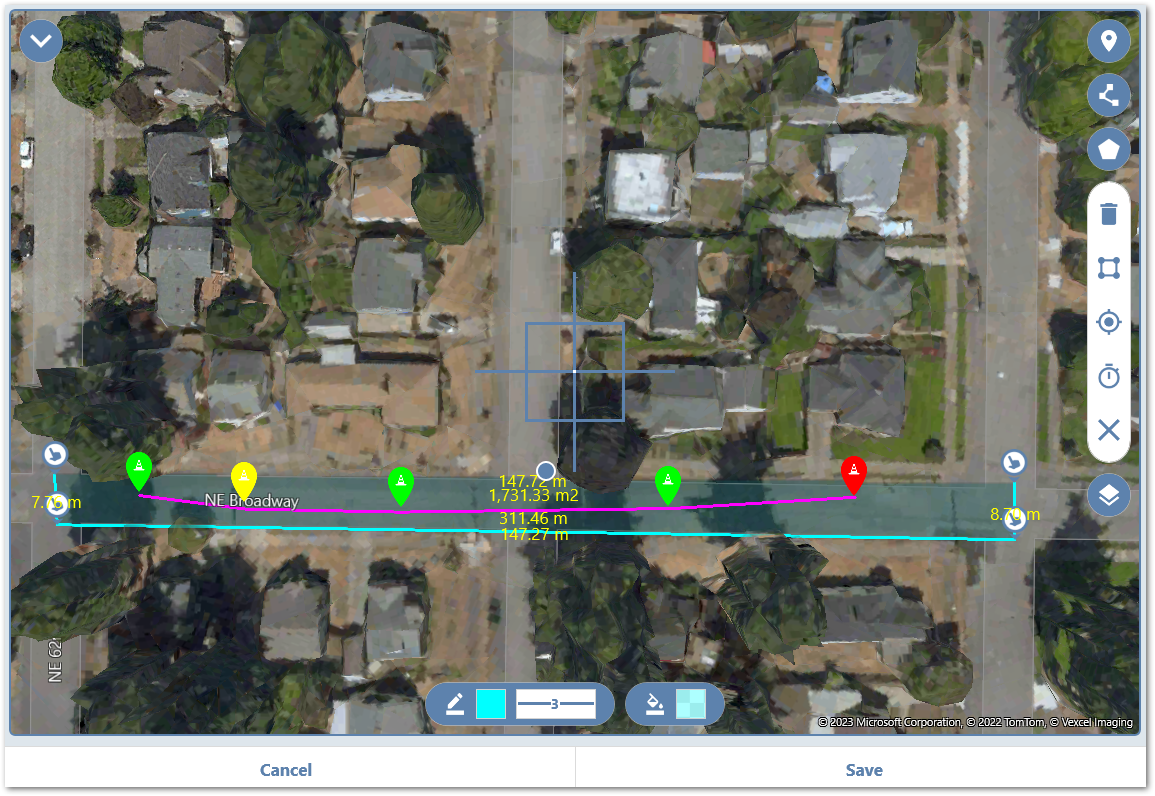
Multiple attributes can be configured for each feature type. When a point feature is being created or edited, a dialog is displayed at the bottom of the map window which displays, from left to right, the current color of the point, the size of the point (i.e., Small, Medium, and Large), and the symbol displayed on the point. Clicking on the box showing the current color of the point will open a color picker to change the color. Clicking on the size indicator for the point allows users to easily adjust the size of the point. Lastly, a symbol picker opens a dialog with multiple pages of icons are available to incorporate into the point, helping differentiate between points. Line features include the ability to change the line color, line opacity, and width. Polygon features include the ability to change the outline color, outline opacity, outline width, interior fill color, and interior fill opacity.
|
|
|
|
|
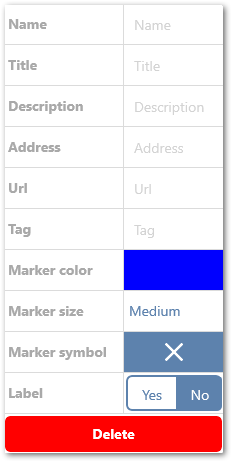
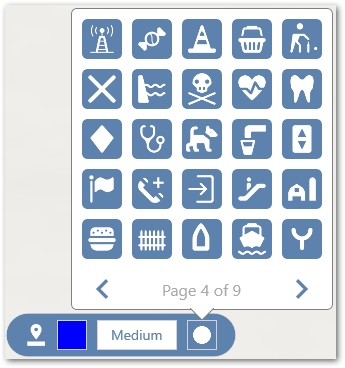
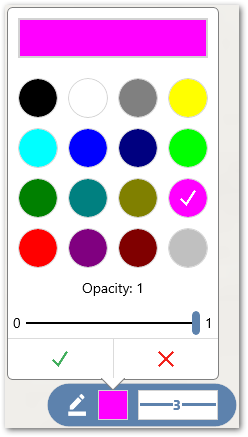
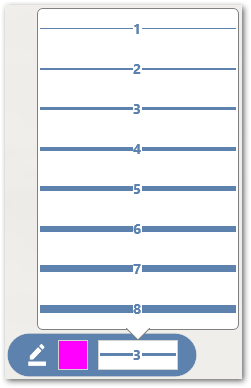
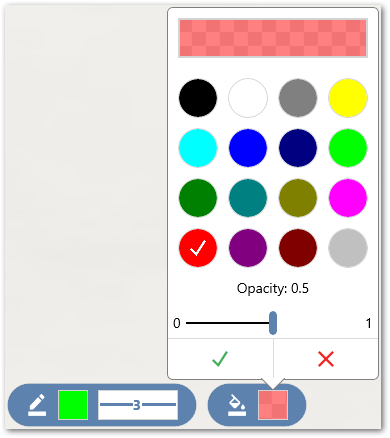
Attribute editing examples from left to right: Attributes for point features, symbol picker for point features, line color picker and opacity slider, line width picker, and interior fill picker and opacity slider for polygon features.
Editing, Moving, and Deleting Features
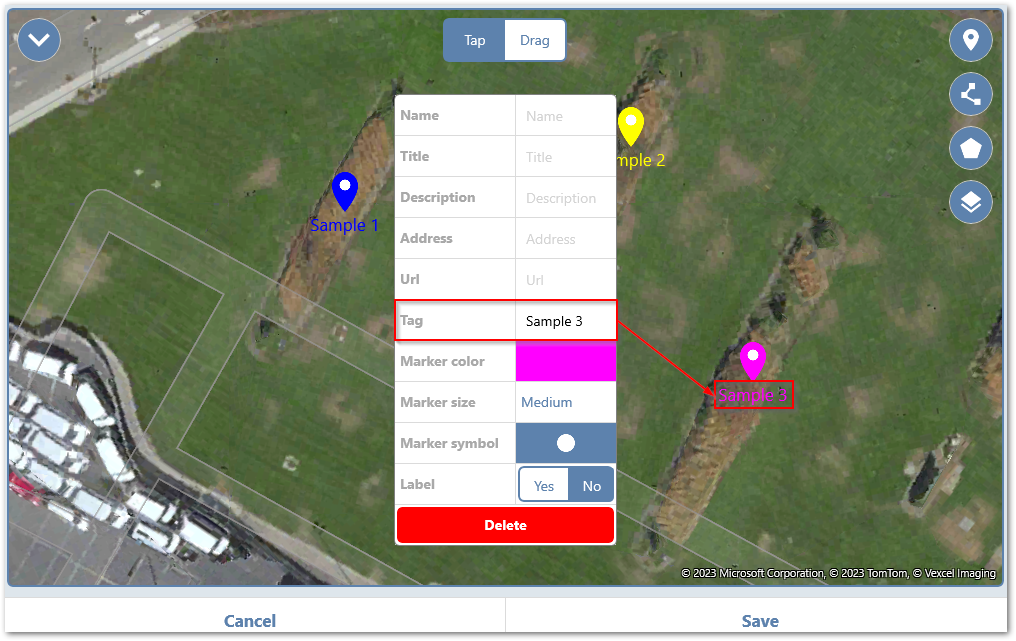
Features can be edited using one of two methods. The first method is to click the Tap button and then selecting the desired feature to open the attribute panel. The second method is to click the Layers/Geographic Collections button, then select the desired feature to open the attribute panel. Point features are displayed with a marker symbol and icon by default. Point features can be displayed with text below the symbol by using the Tag attribute (shown in the screen capture below), which is only available if the Label toggle is set to FALSE (example screen capture below). Attributes can be edited to display as text if the Name attribute is updated and the Label toggle is set to TRUE. Features can be moved by clicking the Drag button and then selecting the feature to move. For point features, hold and drag the feature to the desired location. For line and polygon features, a Move Vertex ![]() icon will be displayed at each vertex, allowing the features to be adjusted as needed. The Layers/Geographic Collections button also allows the order of the existing layers to be adjusted by clicking the Reorder Layer buttons. To delete a feature, click the Tap button, select the feature to delete, and select "Delete".
icon will be displayed at each vertex, allowing the features to be adjusted as needed. The Layers/Geographic Collections button also allows the order of the existing layers to be adjusted by clicking the Reorder Layer buttons. To delete a feature, click the Tap button, select the feature to delete, and select "Delete".
Notes: •If a point feature, that has a Tag property configured, is being moved, the tag will be realigned with the feature once the point has been moved. •If the Tag property is configured, then removed for a point feature, the tag text will remain visible until another button is clicked or the Map Plot is saved. •If the Tag property is configured, then the Label toggle is moved from FALSE to TRUE to FALSE, the Tag configuration will be lost and will need to be reentered. |
|---|