Overview
Users can run EQuIS reports (that include X and Y coordinates in the output) directly in ArcGIS Pro and automatically add the report output to the map as either a Link or Snapshot layer. The base reports need to be published to the database to be available in the Reports modal.
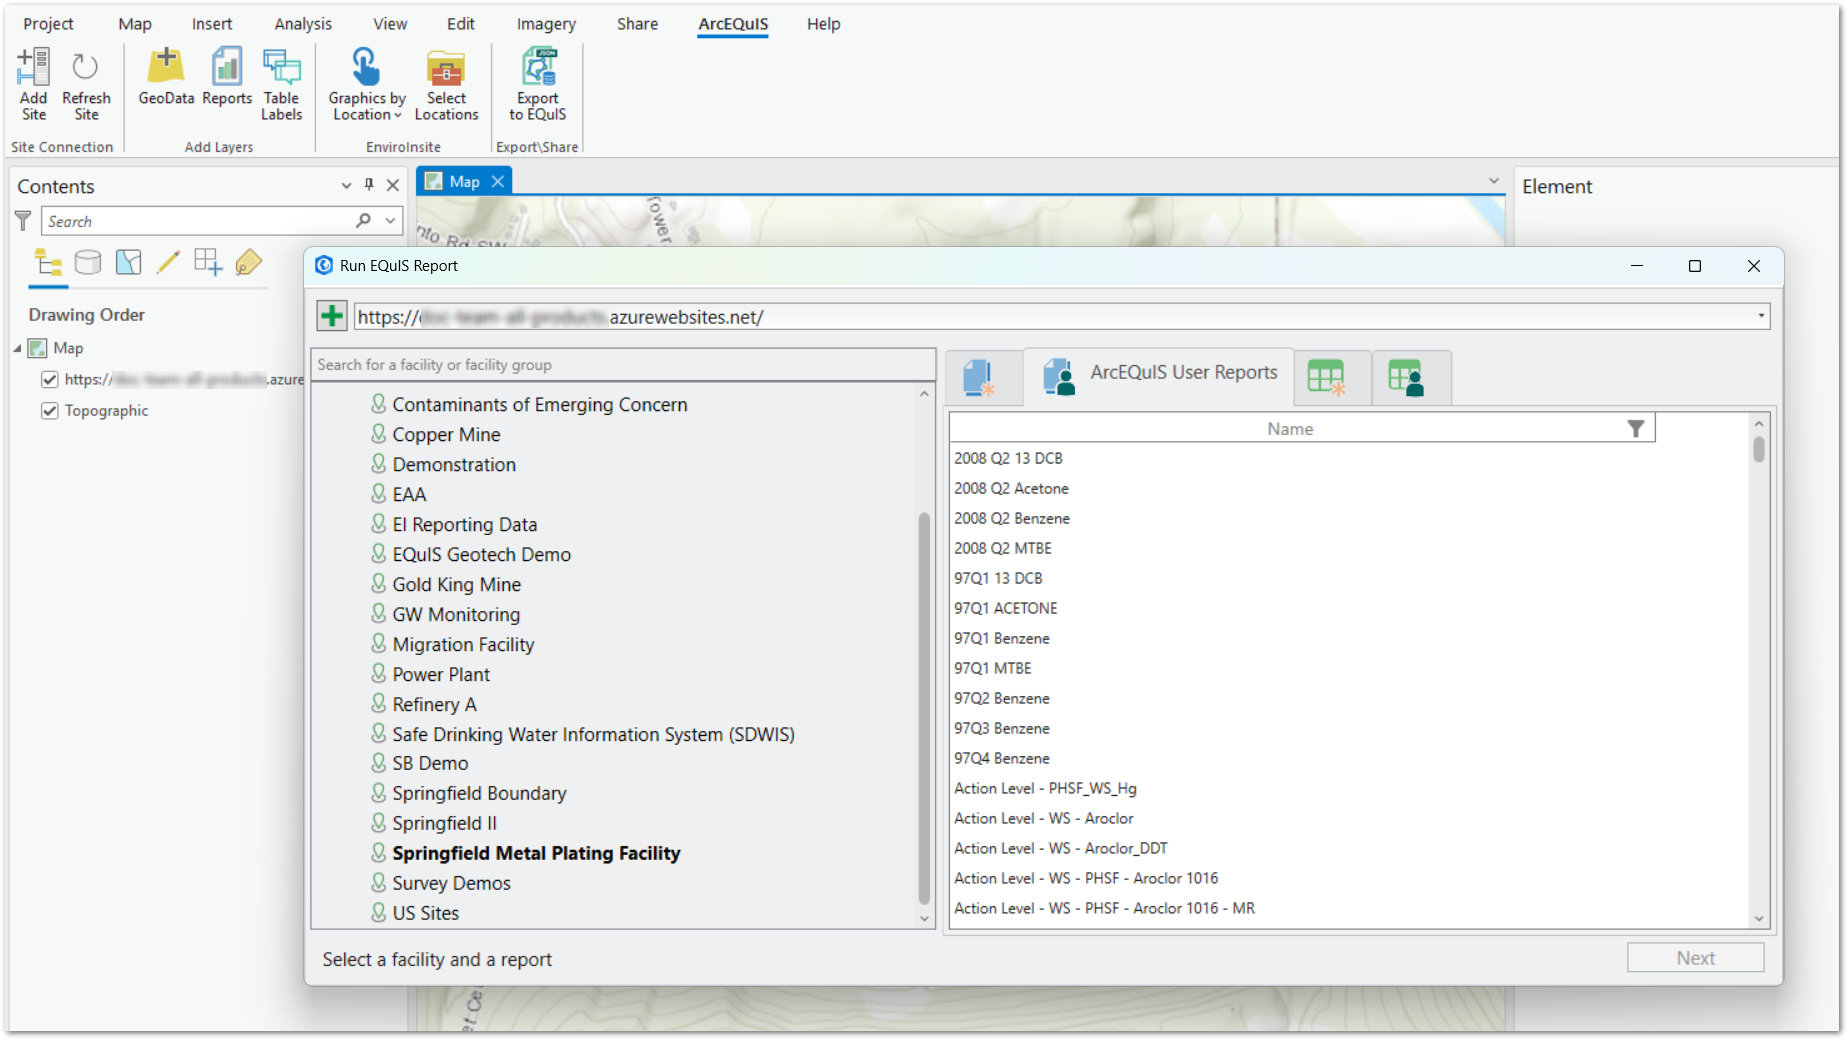
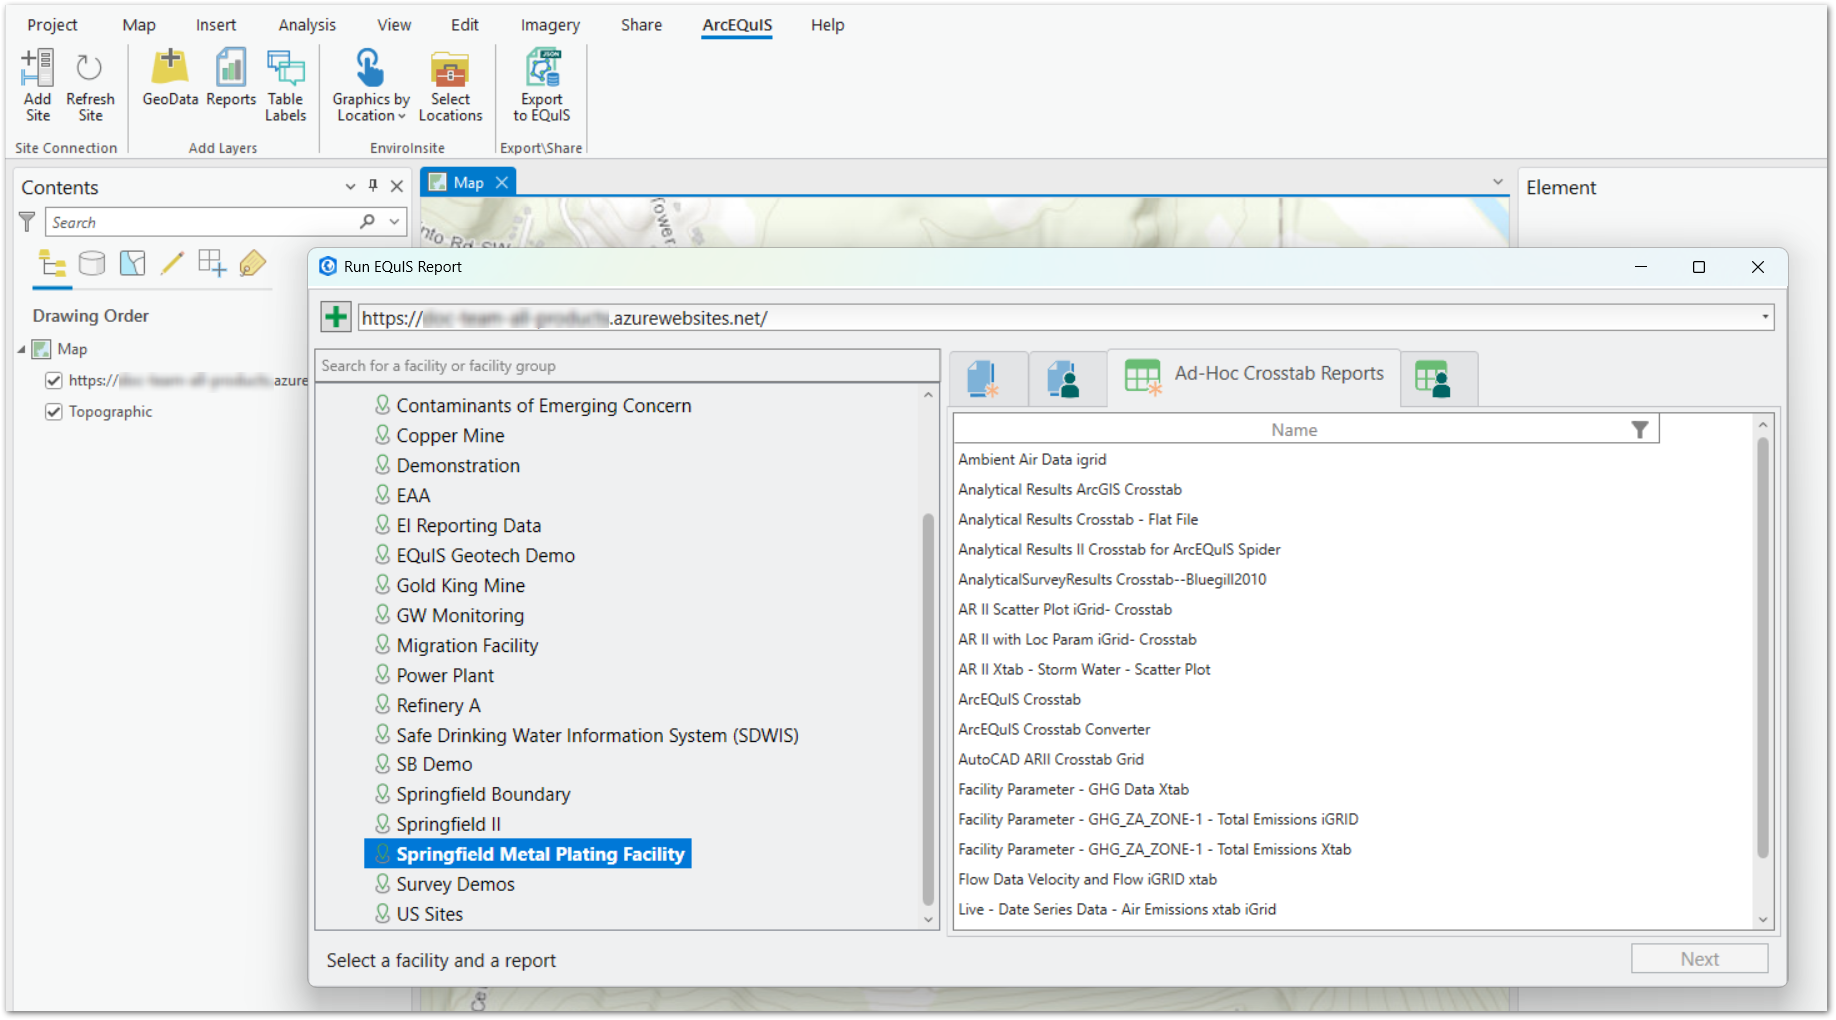
Users can run published user reports, base grid reports to create ad hoc user reports, and ad hoc or published crosstab reports to add EQuIS data as map layers. Each of these report types are available on separate tabs in the Run EQuIS Report Modal:
•EQuIS Ad-Hoc Reports – Published base grid reports
•ArcEQuIS User Reports – Saved user reports (for a base grid report)
•Ad-Hoc Crosstab Reports – Published crosstab (base) reports (with X and Y coordinates), including ArcEQuIS Crosstab and ArcEQuIS Crosstab Converter reports
•Crosstab User Reports – Saved crosstab user reports (with X and Y coordinates)
For each of the reports, users can select specific report parameters and save the report output to the database as well as create the map layer.
To use the Report Modal functionality, users must:
•Be assigned to the REST API role.
•Have the following permissions, at minimum, to add a report to ArcEQuIS:
•Viewer permission on the Facility object type for the facility/facility group associated with the report being created.
•Creator permission on the Reports object type.
Note: As of the 24.3 Build, Professional populates metadata in ST_REPORT.REPORT_INFO when a grid report is published and ArcEQuIS REST API endpoints use this metadata to populate reports in the Run EQuIS Report Modal. Thus, all base reports of type 'class' published to the database prior to the 24.3 Build need to be republished to display. |
|---|
Report Parameter Editor
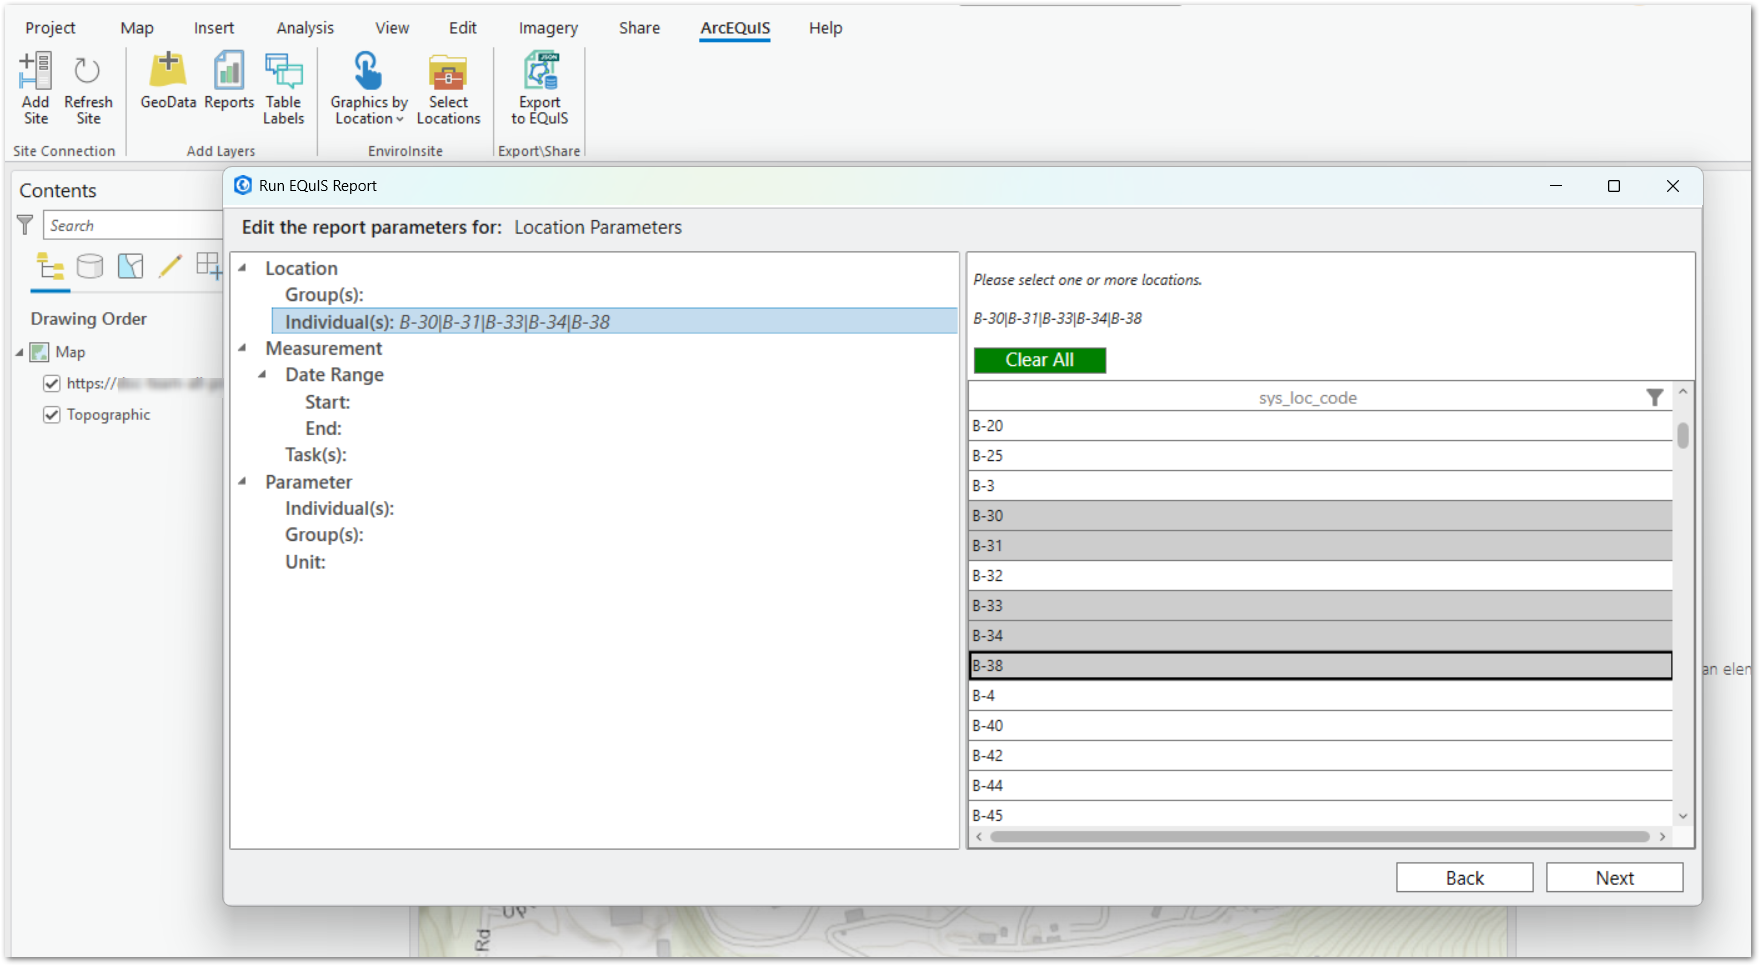
For each of the reports, users can select specific report parameters. Within the Run EQuIS Report Modal, report parameters are grouped in an expandable tree structure in the left pane. To show all parameters within a group, expand the node by clicking on the name of the group (e.g., Location < Individual(s)). When a parameter is selected, values for the selected parameter are displayed in the right pane. There are six different types of parameter values:
•Multi-Select List – Multiple values can be selected from a list of values at one time. A filter icon in each column header allows users to narrow down the list of parameters and a Clear All button allows users to easily clear selections.
•Single-Select List – One value can be selected from a list of values. A filter icon in each column header allows users to narrow down the list of parameters and a Clear All button allows users to easily clear selections.
•Date Selector – A date value is selected from a date picker.
•Text Box – Text is entered into a text box as the value for the selected report parameter.
•Boolean – A Yes or No value is set for the selected report parameter.
•Required – Any field type can be required, denoted by a red asterisk (*), and a report parameter value must be selected before being able to advance this process.
Selected report parameter values are listed next to the selected report parameter, separated by the pipe (|) character.
EQuIS Ad-Hoc Reports Tab
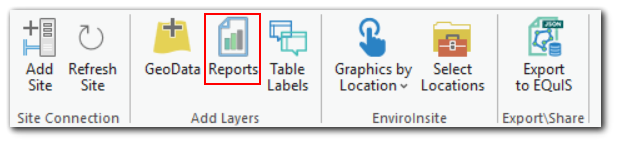
1.Click the Reports button on the ArcEQuIS ribbon to open the Run Reports window.
2.Select the EQuIS Ad-Hoc Reports tab.
3.Select the desired facility/facility group and base report, and then click Next. The window will default to last selected facility.
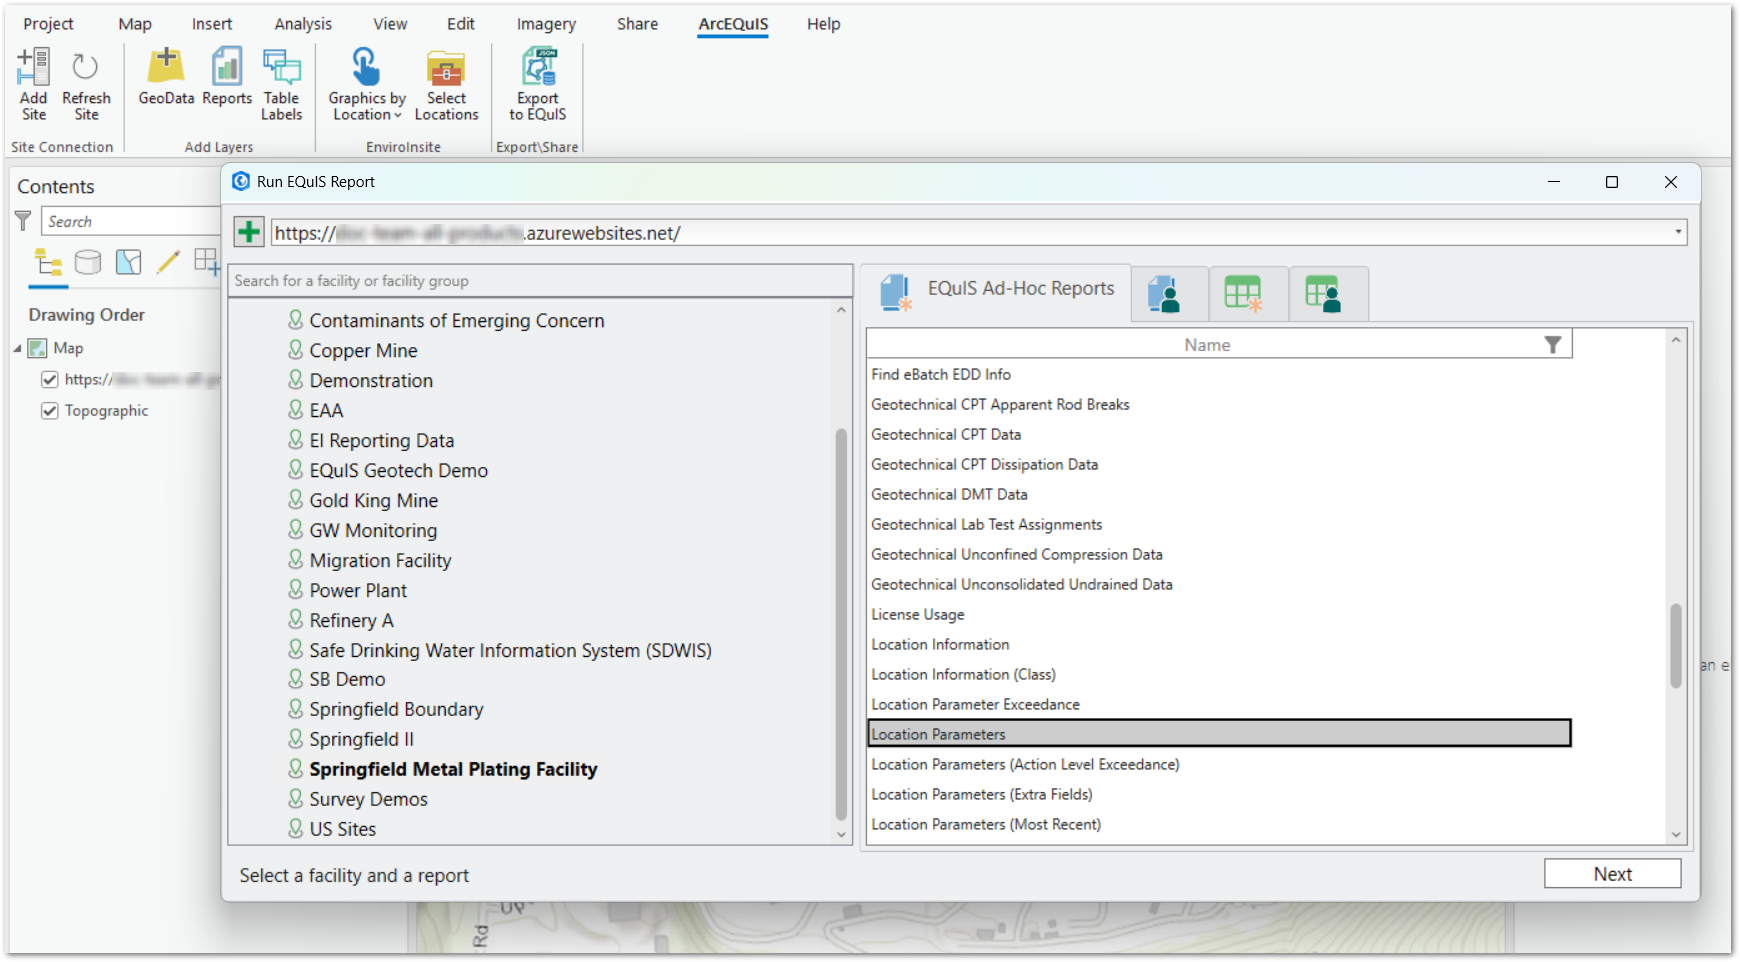
Note: The Next button will be disabled unless both a facility (or facility group) and report are selected. |
4.Report Parameters – Select the desired report parameters in the window. See the Report Parameter Editor section for operational details. Selected report parameter values are listed next to the selected report parameter, separated by the pipe (|) character. Click Back to return to the facility and report selection screen or click Next to preview the ad hoc report output.
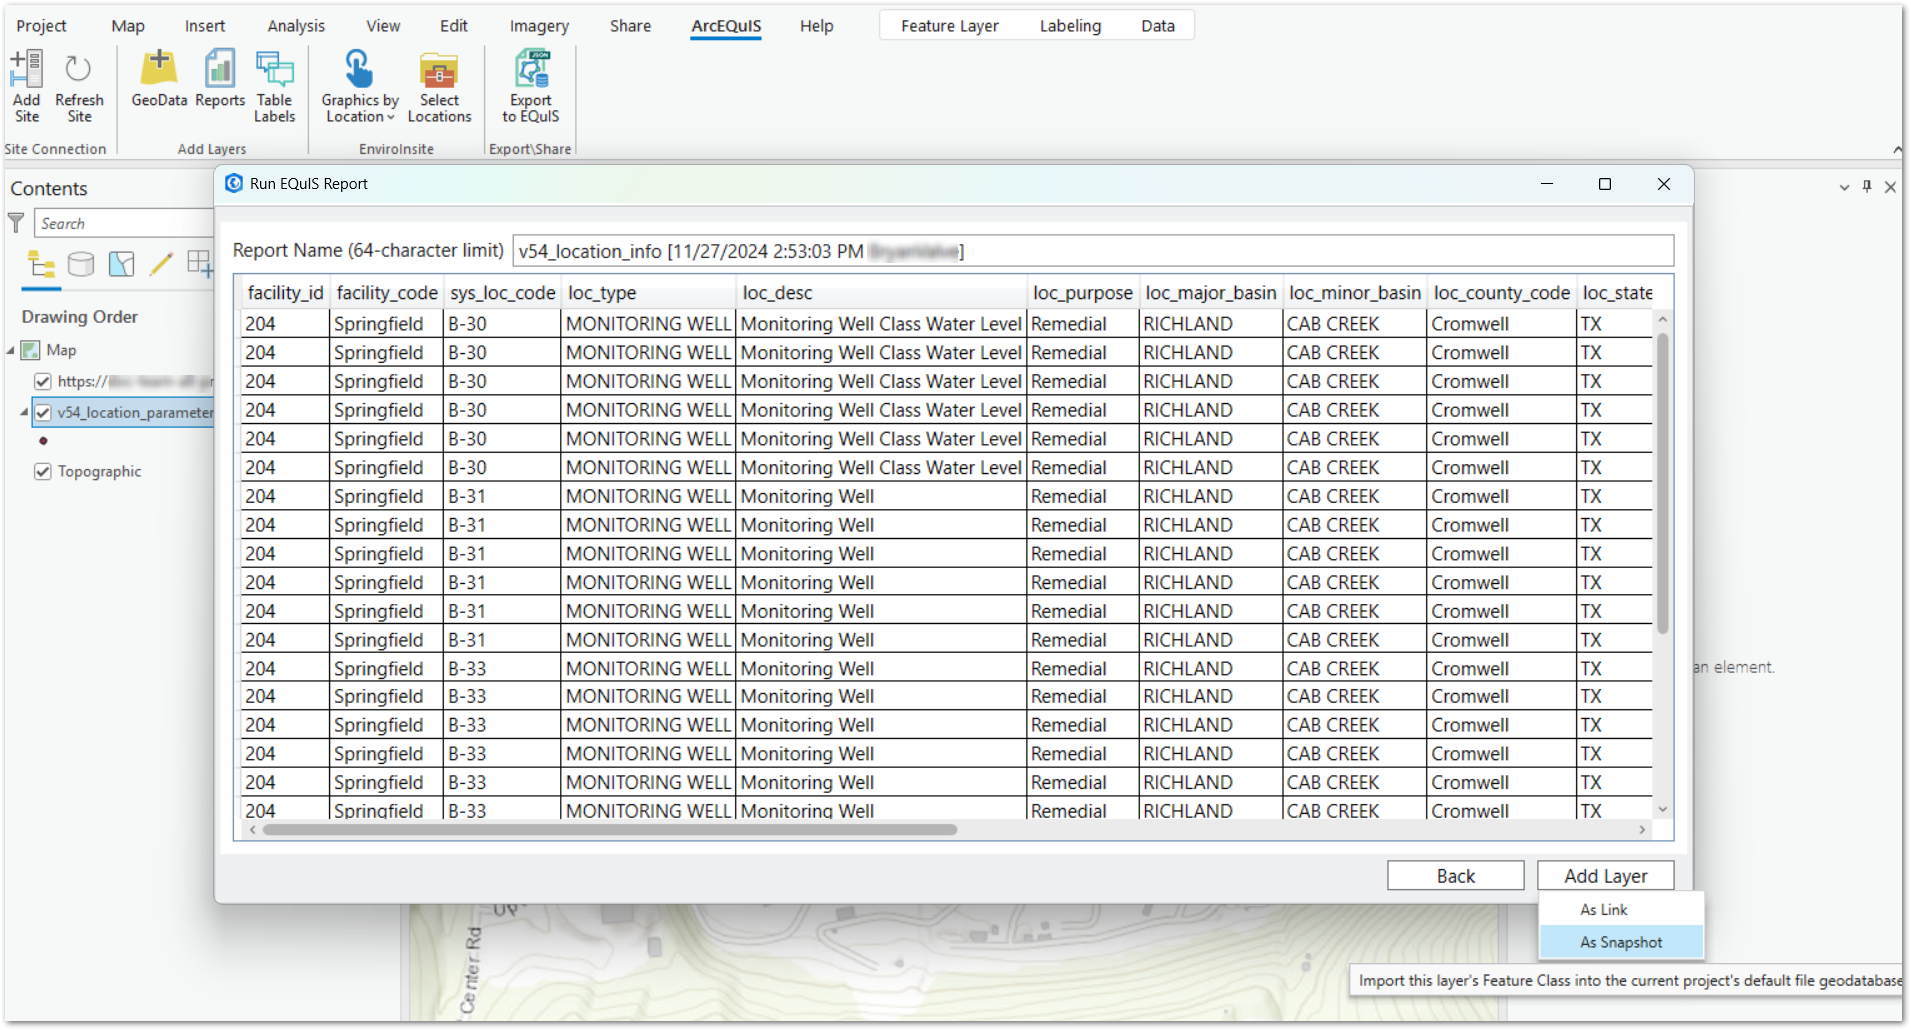
5.The ad hoc report output preview, based on the selected report parameters, can be reviewed to ensure the expected information is included in the report prior to adding the report layer to the map. If changes to the report parameters need to be made, click the Back button. Before adding the report to the map, users are able to add a custom name for the user report that will be saved when adding a layer is completed. By default, the report name will be the 'Report Name [Now Datetime]' with user name appended.
Notes: •Saved user reports cannot have the same name as reports that already exist within the connected site's database. •Saved user report names cannot contain the following SQL reserved words: ▪EXEC ▪DROP ▪ALTER ▪CREATE ▪DISABLE ▪ENABLE ▪INSERT ▪UPDATE ▪DELETE ▪TRUNCATE •Saved user report names cannot contain more than 64 characters, including white space (i.e., blanks). |
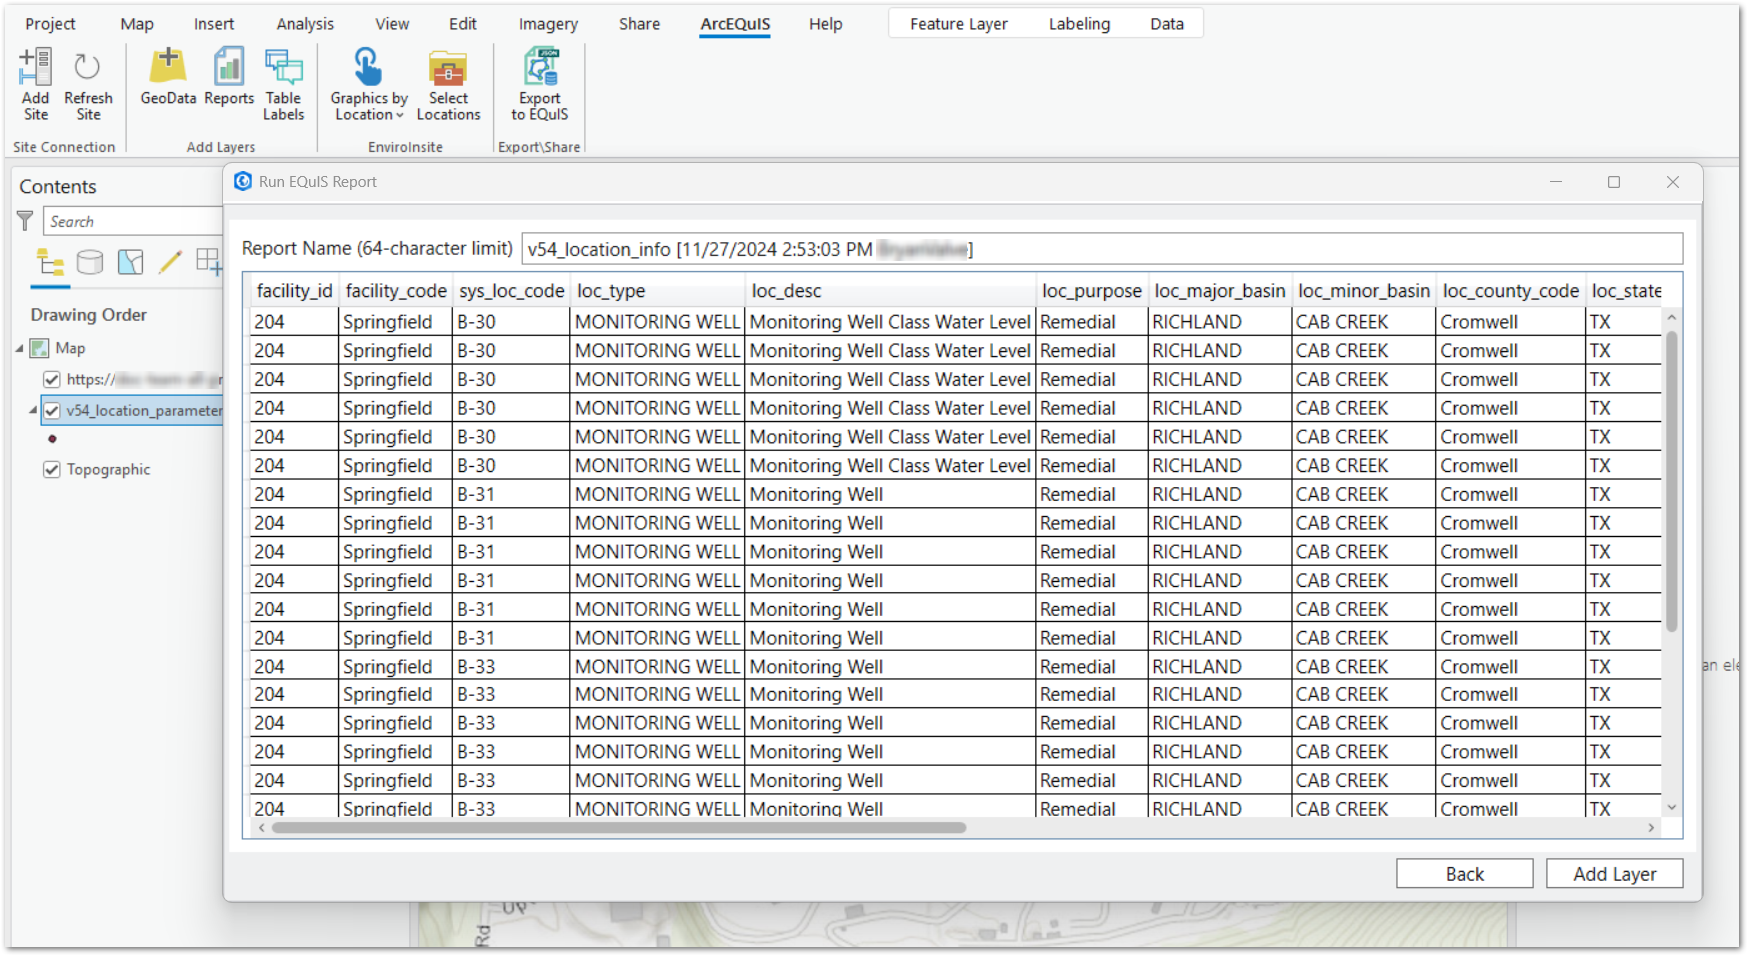
6.Once the ad hoc report preview contains all of the desired information, click the Add Layer button to save the report in the site's database as a user report and display the user report as a map layer.
a.Two options are available, As Link and As Snapshot. The As Link option loads the report with a connection to the Enterprise site, allowing the report to be refreshed to display the most recent data. The As Snapshot option loads a static, point-in-time snapshot of the report whose values are saved in an ArcGIS file on the user's computer.
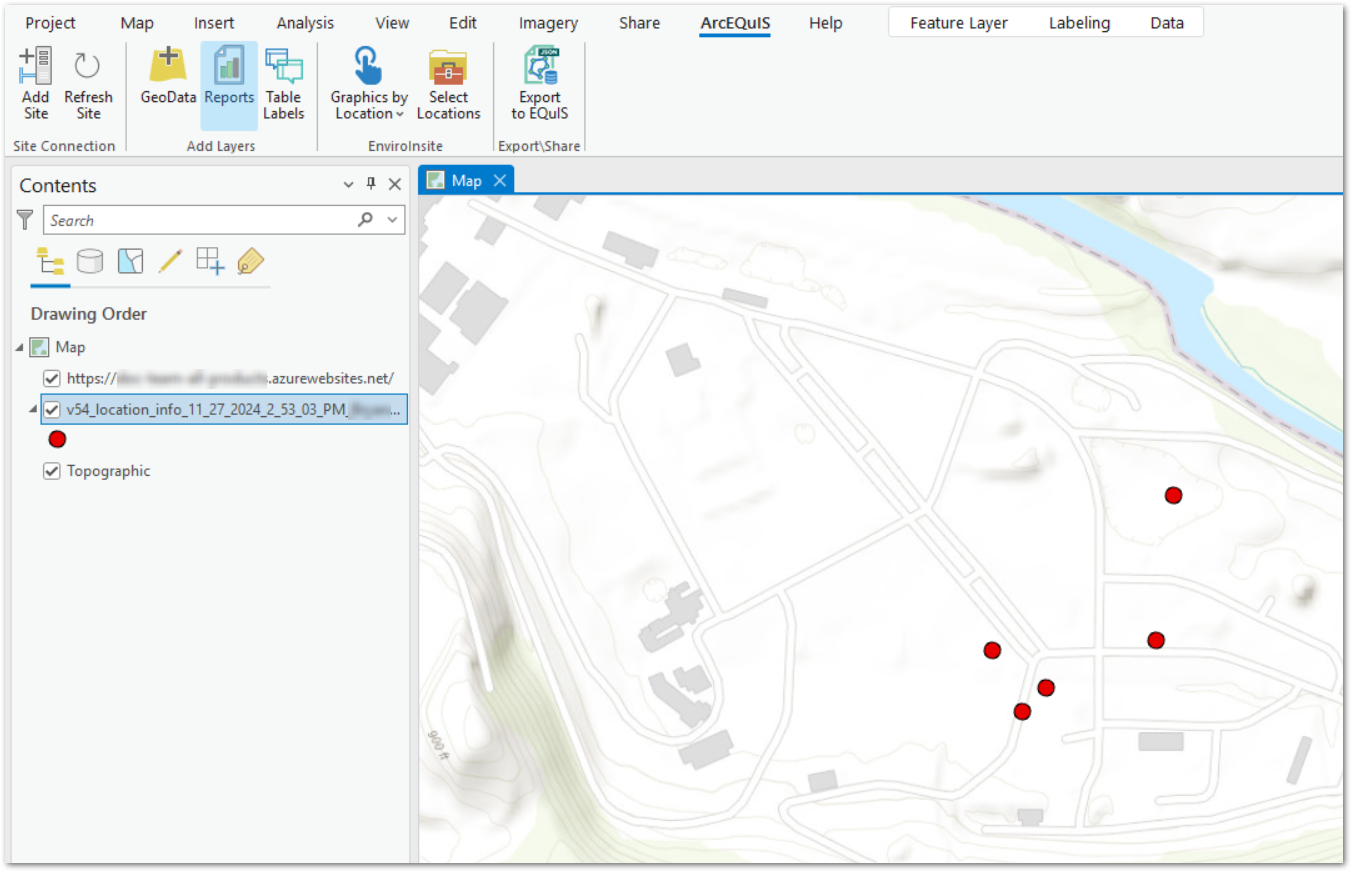
7.The user report layer is displayed on the ArcEQuIS map.
ArcEQuIS User Reports Tab
1.Click the Reports button on the ArcEQuIS ribbon to open the Run Reports window.
2.Select the ArcEQuIS User Reports tab.
3.Select the desired facility/facility group and user report, and then click Next. The window will default to last selected facility.
Follow Steps 4-7 as detailed in the EQuIS Ad-Hoc Reports Tab section. The report name remains the same unless the user makes any changes to parameter selections, then name of report is changed to 'Report Name [Now Datetime]'. The user can modify this auto-generated report name.
Ad-Hoc Crosstab Reports Tab
1.Click the Reports button on the ArcEQuIS ribbon to open the Run Reports window.
2.Select the Ad-Hoc Crosstab Reports tab.
3.Select the desired facility/facility group and crosstab report, and then click Next. The window will default to last selected facility.
4.Report Parameters – Select the desired report parameters in the window. See the Report Parameter Editor section for operational details. Selected report parameter values are listed next to the selected report parameter, separated by the pipe (|) character.
In the Crosstab Configuration parameters, add the X_COORD and Y_COORD fields or the report will not run.
Click Back to return to the facility and report selection screen or click Next to preview the ad hoc report output.
Follow Steps 5-7 as detailed in the EQuIS Ad-Hoc Reports Tab section.
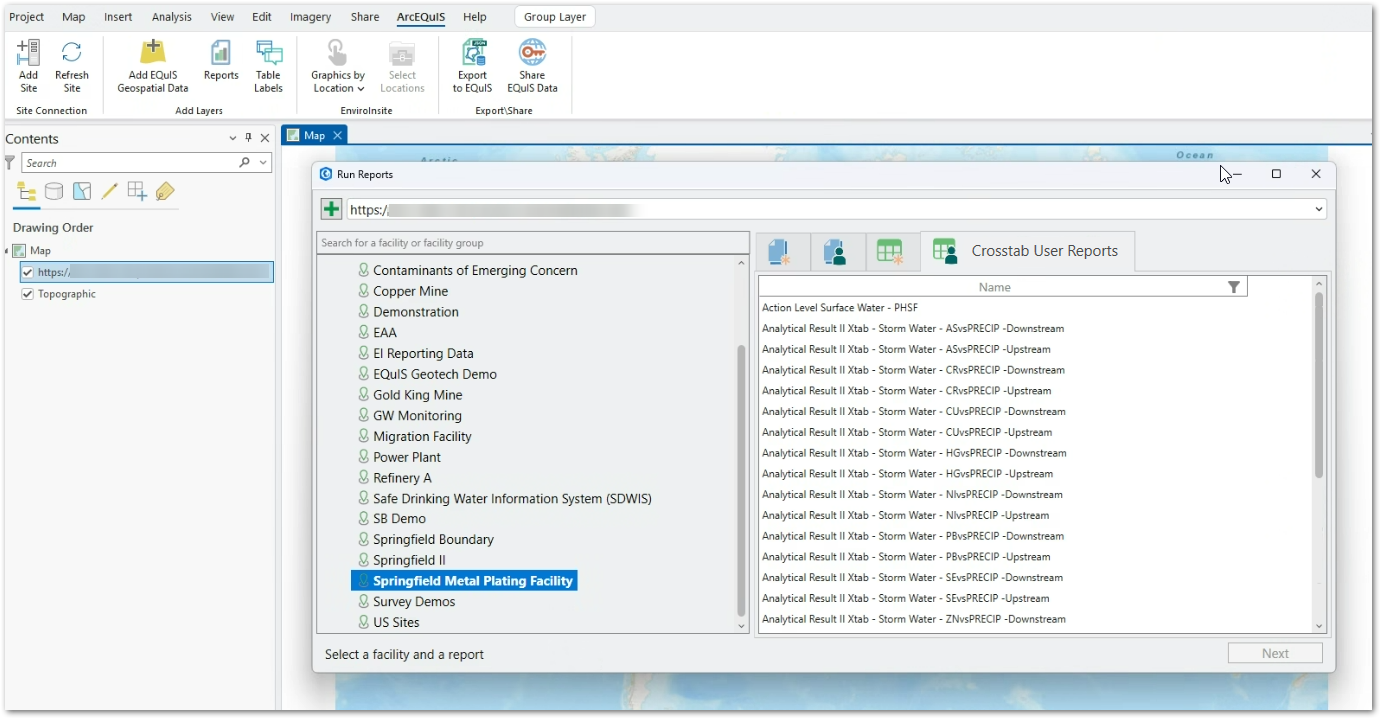
Crosstab User Reports Tab
Published crosstab reports must contain X and Y coordinate columns to be added as layers.
1.Click the Reports button on the ArcEQuIS ribbon to open the Run Reports window.
2.Select the Crosstab User Reports tab.
3.Select the desired facility/facility group and crosstab report, and then click Next. The window will default to last selected facility.
Follow Steps 4-7 as detailed in the EQuIS Ad-Hoc Reports Tab section. The report name remains the same unless the user makes any changes to parameter selections, then name of report is changed to 'Report Name [Now Datetime]'. The user can modify this auto-generated report name.