EnviroInsite provides two methods for the identification of positive or negative trends: Mann Kendall and Spearman Rank Correlation.
•View the source code for the Spearman Rank Correlation test here.
•View the source code for the Mann Kendall test here.
The Mann Kendall method tests the statistical hypothesis that there is an upward or downward trend with a specified probability. This is a non-parametric test, which means that it makes no presumptions about the underlying statistical model from which the data is drawn. The test is carried out by first sorting the data temporally and then comparing each of the sampled data points. An S score is calculated, which is essentially the net number of point-pairs indicating an upward trend. A positive S score indicates the possibility of an upward trend. A statistical test is applied to determine whether the S score is sufficiently large to indicate that the trend hypothesis is accepted for a preset level of probability.
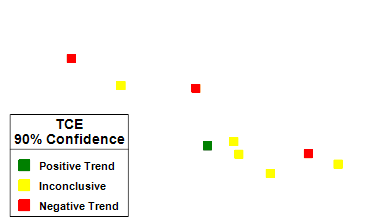
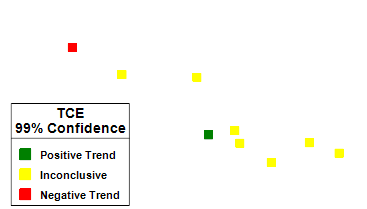
The higher the level of confidence, the greater the number of inconclusive trends. The following two examples demonstrate an evaluation of trends in TCE concentration. For an evaluation with 90% confidence, there are two fewer inconclusive trends than when the trends are determined with a 99% confidence level.
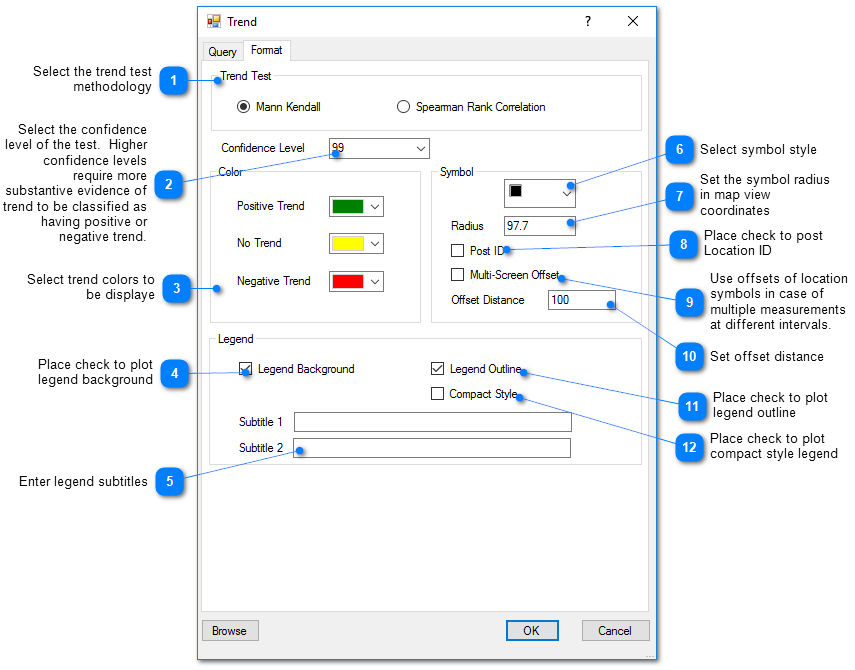
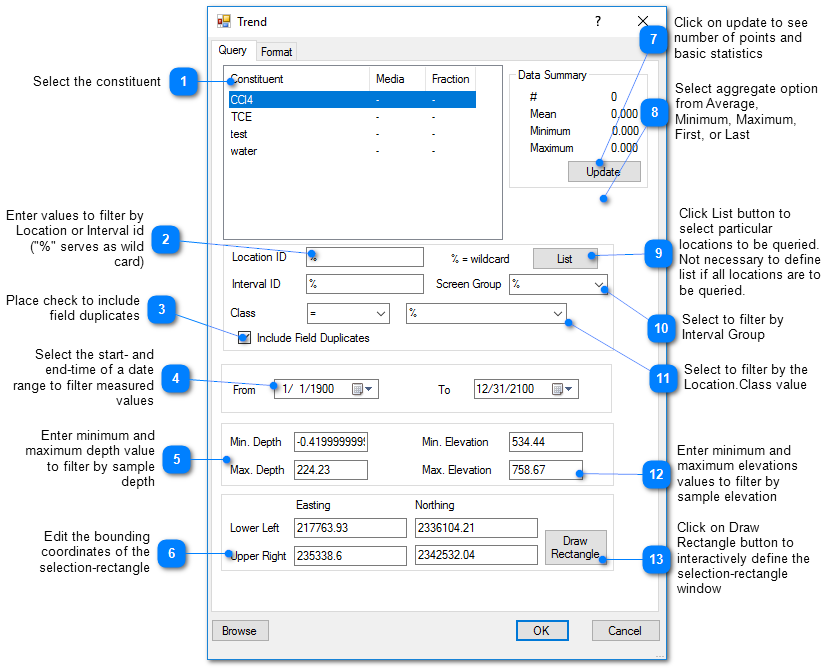
Click Plot> 2D Data from the main menu and select Trend Test. The Trend dialog box opens. Modify the properties for the trend test on the Query tab and Format tab as desired. Click the OK button to save changes.
Query Tab
Format Tab