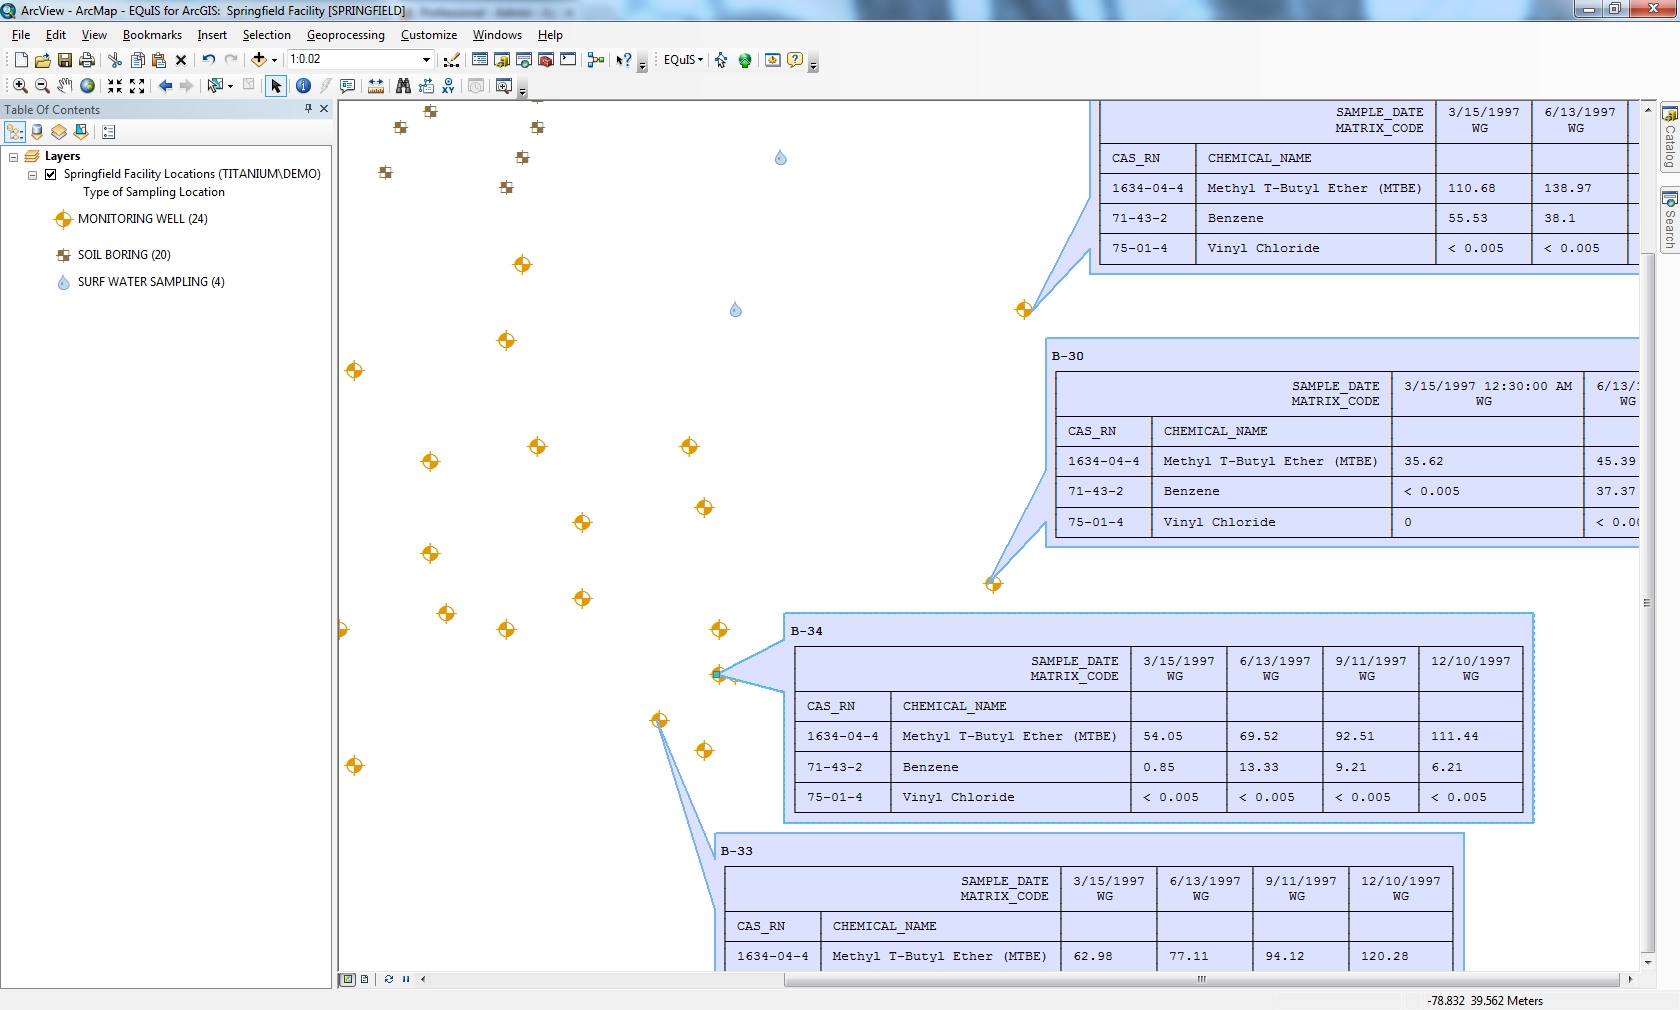
The EQuIS for ArcGIS extension (in ArcMap) contains a menu item for plotting spider diagrams. The functionality allows users to plot any published crosstab report (assuming the "Separate Tables By" option is set to SYS_LOC_CODE). The crosstab tables are exported as text map annotations and stored in the map document (*.mxd) file. Users may reposition the annotations (using the Drawing toolbar in ArcMap), and the next time tables are plotted, the updated tables will be displayed in the same position(s).
Instructions
1.Open ArcMap (make sure the EQuIS for ArcGIS extension is enabled and the EQuIS for ArcGIS toolbar is visible).
2.Click EQuIS ... Add Facility to add the facility to the map.
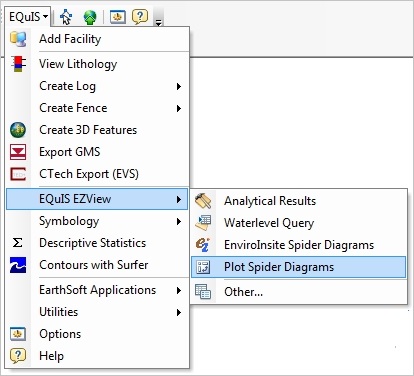
3.Choose EQuIS ... EQuIS EZView ... Plot Spider Diagrams.
4.Choose the published crosstab report to plot (only published crosstab reports will be displayed).
5.Choose the desired input parameters.
6.Click the green Go button to run the report.
The tables will be plotted as shown below.
Features
•Tables are saved as graphic text map annotations and can be positioned as desired.
•The annotations are saved in an Annotation Group (i.e., graphics layer). Right-click Layers (in the Table of Contents), choose Properties, then choose the Annotation Groups tab.
oUsers can show/hide annotations by checking/unchecking the Annotation Group.
oThe default Annotation Group is called "Spider Diagram". If that group exists (with the same name), then the content of the annotations will be updated each time users plot crosstab tables (this can be useful if a user wants to define a specific table layout and have new or different table content plotted in the same layout).
oIf users rename the default Annotation Group, then a new "Spider Diagram" group will be created the next time crosstab tables are plotted. The table callouts are based on the EarthSoft.style gallery (users can change the "Table Callout" symbol as desired).
•Formatting (e.g., bold, italic, underline, font color) defined in the crosstab configuration will be plotted in the text annotations. See this ArcGIS documentation for more information on supported formatting.
•SYS_LOC_CODE names with spaces are acceptable and can have a spider diagram.
•Font size of the individual tables can be resized following these steps:
oClick the Select tool ![]() first.
first.
oThen right-click a Spider table and open Properties. On the Text tab > Change Symbol > Change Size (larger, smaller).
Limitations
•The published crosstab report may only be plotted if the "Separate Tables By" option of the crosstab configuration is SYS_LOC_CODE.
•The graphic text annotations use extended characters to plot the tables; the tables will only display correctly when using a monospaced font (e.g., Courier New).
•Only text formatting supported by ArcGIS is supported (e.g., users cannot set the background color of individual cells in the table).
•The use of formatting may cause problems if the spider tables are resized in ArcGIS.