•EQuIS Mann-Kendall Calculations
The Mann-Kendall test determines the trend of varying data (whether it increases or decreases over time). This page describes the methods used in EQuIS reporting to evaluate the Mann-Kendall test.
EQuIS Mann-Kendall Calculations
The Mann-Kendall test uses the following equation:
![]()
The calculation compares each value to each of the preceding values in the data set using the sign() function. This function outputs either 1, -1, or 0 depending on whether yj - yi is either positive, negative, or zero respectively. The sum of these calculations within the iteration signifies an upward, downward, or stagnate step.
Mann-Kendall S Value
If the sample size is less than 10, then EQuIS uses the EPA-specified method for small sample sizes as shown in the following set of directions:
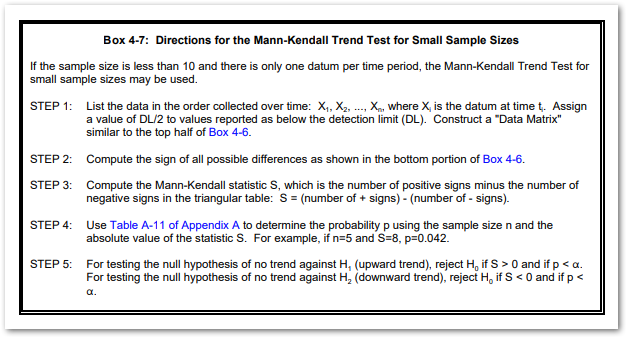
Directions for the Mann-Kendall Trend Test for Small Sample Sizes [source].
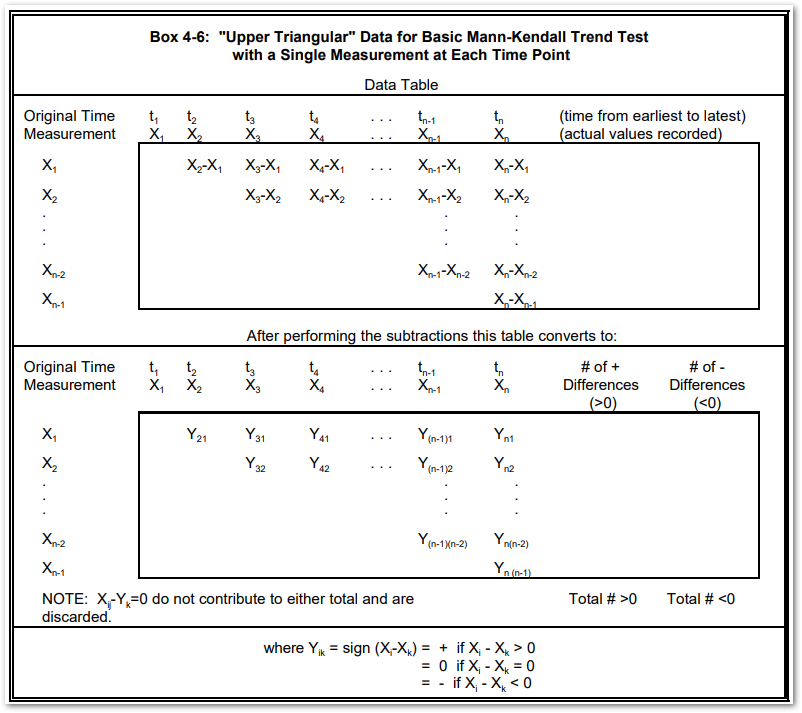
Example Construction of a Data Matrix for the Mann-Kendall Trend Test [source].
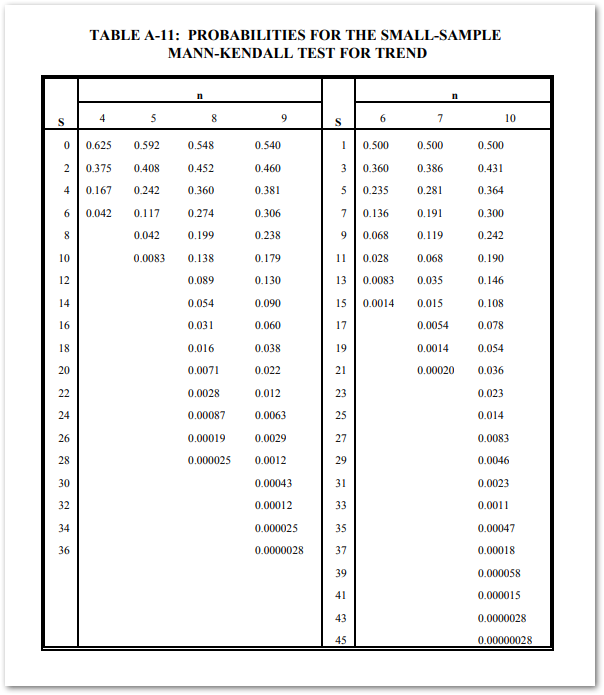
Probabilities for the Small-Sample Mann-Kendall Test for Trend [source].
Notes: •Sample size must be greater than 3 for Mann-Kendall S to be calculated. |
Should the sample size be 10 or greater, then the variance of the Mann-Kendall S value is calculated by Normal Approximation:
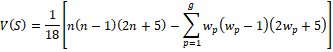
where g is the number of tied groups (where a number has repeated) and wp is the number of data points (tied values) in the pth group
For example, a dataset of {17, 14, 39, 16, 39, 14, 14, 39, 17, 39} contains the following:
•Three tied groups (g = 3) for 14, 17, and 39
•Tied group 1 (p = 1) for the three values of 14 (w1 = 3)
•Tied group 2 (p = 2) for the two values of 17 (w2 = 2)
•Tied group 3 (p = 3) for the three values of 39 (w3 = 4)
Mann-Kendall Z Value
The following conditions for the Mann-Kendall S value determine the next step in calculation:
1.If S > 0:
![]()
2.If S < 0:
![]()
3.If S = 0, then Z = 0.
The Z value is then checked with the following conditions (see table below) to test the null hypothesis – that there is no monotonic trend, i.e. no increasing or decreasing between two subsequent steps. The corresponding confidence level of rejecting that hypothesis is then assigned.
Values |
Confidence Level |
|---|---|
|
99.5 |
|
97.5 |
|
95 |
Note that α = 1 - (confidence percentage).
EQuIS Mann-Kendall Tests
The following EQuIS reports perform Mann-Kendall calculations:
•Analytical Results - Statistics
•Analytical Results II - Statistics
•Statistics: Analytical Statistics (by Location)
EnviroInsite uses a separate method of evaluating the Mann-Kendall test. For more information, see Mann Kendall Trend Evaluation.
In EQuIS, the sign difference between the detect or non-detect (Process multiple non-detect limits of an analyte at a location parameter) entries are compared for each summation step, and these iterations are added through a double summation to determine the total count as the Mann-Kendall S value.
Note: The “Process multiple non-detect limits of an analyte at a location” parameter can be set at Max, Min, Average, or Last, defaulting to Last if there is no selection. |
Source – Guidance for Data Quality Assessment: Practical Methods for Data Analysis, EPA QA/G‐9, US EPA Office of Environmental Information EPA/600/R‐96/084, July 2000