Form Name: Analyte Concentration Map
File Name: EarthSoft.Forms.Library.EnviroInsite.dll
Software: EQuIS Professional, EnviroInsite
Source: EnviroInsite install
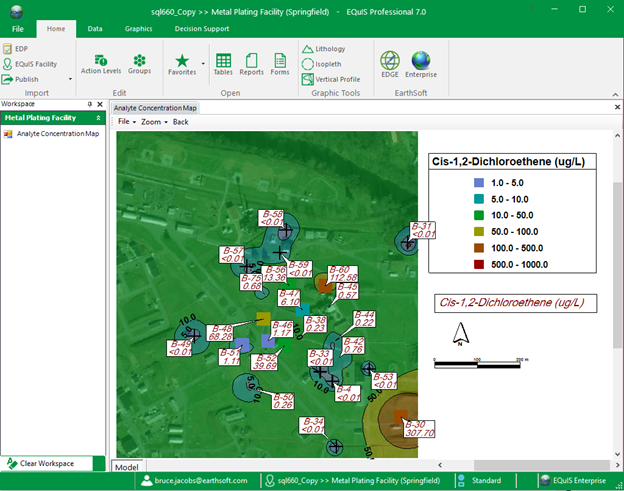
Description: The Analyte Concentration Map Form generates map reports of results for a single analyte featuring the elements outlined below.
Installation Instructions: The Analyte Concentration Map Form is part of the EarthSoft.Forms.Library.EnviroInsite.dll assembly. This assembly is deployed into the EQuIS Professional installation directory when EnviroInsite is installed (C:\Program Files\EarthSoft\EQuIS\) or (for per-user installation) %localappdata%\Programs\EarthSoft\EQuIS\. For non-default installations, this assembly should be copied into the custom EQuIS Professional installation directory.
Instructions:
1.Basemap – For no map display, specify 'None'. Three basemap styles are available, drawn from online map or photo image sources. Visit linked sites for details.
•Azure Maps (Light and dark street maps, satellite imagery)
•Imagery (ArcGIS Aerial Photo)
•Street Map (ArcGIS Map)
•Topographic (ArcGIS Topo)
The base map boundaries (minimum and maximum northing and easting values) are initialized using the values of DT_FACILITY.X_MIN, DT_FACILITY.X_MAX, DT_FACILITY.Y_MIN, and DT_FACILITY.Y_MAX. If these DT_FACILITY fields are not populated, then the values are based on DT_COORDINATE.X_COORD and DT_COORDINATE.Y_COORD. If the values are in a latitude-longitude coordinate system, they will be converted to the display coordinate system.
Note the horizontal extent for the data query is not accessible from the Form parameter menu.
2.Posted Values – Location names (SYS_LOC_CODE) and average analyte concentrations are posted within boxes connected by a leader to the sample locations.
3.Symbol Plots – Measured analyte concentrations are represented using symbols that are color-coded to indicate the concentration at the symbol location.
4.Contours – Isocontours are drawn based on values from the measured analyte concentration values that are interpolated onto points on a rectangular grid. These contours may be either simple lines or with fill between the drawn lines.
This form report requires that sample interval depths and elevations be associated with all measured data per instructions in Sample Interval Depths and Elevations.
The location of individual components (e.g. north arrow, map scale, legends, and posted values) may be modified by dragging the items within the map interface and dropping them in their new locations.
The EQuIS facility must be configured in a latitude/longitude coordinate system or supported SRID. Maps are plotted in UTM coordinates. EnviroInsite determines the coordinate system to be used based on the value in the EQuIS data field RT_COORD_TYPE.SRID associated with the DT_FACILITY.COORD_TYPE_CODE for the connected facility. In that case, the display coordinates will be in UTM, within the UTM zone at the center of the extent of the location positions. If the coordinates are entered in latitude/longitude, then EnviroInsite will find the correct zone for those cases where the SRID value is not populated.
SRID values starting with 326 are presumed to indicate UTM coordinates within the northern hemisphere. SRID values starting with 327 are presumed to indicate UTM coordinates within the southern hemisphere. The final two digits for these SRIDs are taken to be the UTM longitudinal zone. State plane coordinates are not supported at this time.
Input Parameters: The following parameters may be selected from the standard EQuIS parameter selection interface. After the map has been generated, users may elect to double-click on individual components to bring up dialog boxes that allow for further customizing of the plot contents.
Refer to the EQuIS EnviroInsite documentation for a complete description of the generated object properties. For example, see the articles for Post Data, Classed Post, or 2D Contour under Plan View / 3D Objects> Measured Data.
Parameter |
Description |
Required? |
|---|---|---|
Contour Data |
Check to generate contours of the selected analyte values. |
|
Plot Symbols? |
Check to plot symbols that are color-coded based on the selected analyte values. |
|
Post Values? |
Check to post the analyte values at the measured locations. |
|
Base Map |
||
Map Source and Style |
Select from an aerial photo, map, or topographic map from ArcGIS Online aerial photo. Select 'None' to not plot a base map. |
|
Minimum Easting |
Enter the minimum easting value of the generated base map in UTM coordinates. |
YES, unless 'None' selected for Map Source and Style |
Maximum Easting |
Enter the maximum easting value of the generated base map in UTM coordinates. |
YES, unless 'None' selected for Map Source and Style |
Minimum Northing |
Enter the minimum northing value of the generated base map in UTM coordinates. |
YES, unless 'None' selected for Map Source and Style |
Maximum Northing |
Enter the minimum northing value of the generated base map in UTM coordinates. |
YES, unless 'None' selected for Map Source and Style |
Data |
||
Constituent |
||
Analyte |
Select one analyte. |
YES |
Fraction |
Select the fraction value used to filter, based on DT_TEST.FRACTION. |
YES |
Matrix |
Select the matrix value used to filter, based on DT_SAMPLE.MATRIX. |
YES |
Units |
Select the concentration display units. |
NO |
Aggregate Function |
Select method to aggregate multiple analyte values at single location from mean, minimum, maximum, first, or last. |
YES |
Format |
||
Interval Values |
Enter the contour and symbol interval values as comma- delimited list. |
YES, if either Contour Data or Plot Symbols is selected |
Digits after Decimal |
Enter the number of digits after the decimal used in posted values and in legends of contour and symbol plots. |
YES |
Text Height |
Enter the text height in map units. |
YES |
Symbol Radius |
Enter the symbol radius in map units. |
YES, if Plot Symbols selected |
Contour |
||
Style |
Select from either line or fill contour styles. |
YES, if Contour Data selected |
Interpolation Method |
Select interpolation method used to estimate values on rectangular grid in process of generating contours. |
YES, if Contour Data selected |
Kriging range value in |
Set the kriging range value used to specify horizontal persistence in east-west direction. |
YES, if Contour Data selected |
Kriging range value in |
Set the kriging range value used to specify horizontal persistence in north-south direction. |
YES, if Contour Data selected |
Log Transform |
Place check to carry out contour generating using log-transform of analyte concentrations. Useful for instances where concentration variation over multiple orders of magnitude. |
|
Percent Transparency |
Enter percent transparency for fill contours. |
YES, if Contour Data selected |
Minimum Easting |
Enter the minimum easting value of the rectangular grid on which the contours are plotted. |
YES, if Contour Data selected |
Maximum Easting |
Enter the maximum easting value of the rectangular grid on which the contours are plotted. |
YES, if Contour Data selected |
Minimum Northing |
Enter the minimum northing value of the rectangular grid on which the contours are plotted. |
YES, if Contour Data selected |
Maximum Northing |
Enter the maximum northing value of the rectangular grid on which the contours are plotted. |
YES, if Contour Data selected |
# of Grid Rows |
Enter the number of rectangular grid rows. |
YES, if Contour Data selected |
# of Grid Columns |
Enter the number of rectangular grid columns. |
YES, if Contour Data selected |
Label Density |
Enter the label density, where reduced densities result in fewer labels being placed. |
YES, if Contour Data selected |
Skip Interval |
Enter the skip interval that controls the contour intervals for which labels are generated. A value of 1 results in all contour lines being generated. A value of 2 results in every other contour line being labeled. |
YES, if Contour Data selected |
Location |
||
Individual(s) |
Enter individual locations to be plotted. |
NO |
Group(s) |
Enter one or more location groups. |
NO |
Sample |
||
Type |
Enter sample type. |
NO |
Date Range |
||
Start Date |
Enter start date. |
YES |
End Date |
Enter end date, where selection includes samples taken on either sample or end date. |
YES |
Task |
Select one or more sample tasks. |
NO |
Task Code 2(s) |
Select one or more task code 2 values. |
NO |
Field SDG(s) |
Select one or more field SDGs. |
NO |
Depth |
||
Unit |
Enter depth units for depth query. |
YES, if minimum or maximum depth specified |
Maximum Depth |
Enter the maximum sample depth, relative to the vertical center of the sample interval. |
NO |
Minimum Depth |
Enter the minimum sample depth, relative to the vertical center of the sample interval. |
NO |
Test |
||
Method(s) |
Enter one or more test methods. |
NO |
Column Number(s) |
Enter one or more test column numbers. |
NO |
Type(s) |
Select one or more test types. |
NO |
Lab Matrix(ces) |
Select one or more test lab matrices. |
NO |
Prep Method(s) |
Select one or more preparation methods. |
NO |
Lab SDG(s) |
Select one or more lab SDGs. |
NO |
Result |
||
Type(s) |
Select one or more result types. |
NO |
Non-Detect Multiplier |
Enter the non-detect multiplier to be used in designation of values for flagged non-detect results. |
NO |
Reportable |
Select reportable values. |
NO |
Validated |
Select one or more validated values. |
NO |
Data Requirements: Coordinates in a latitude/longitude coordinate system or supported SRID. DT_FACILITY.ELEV_UNIT must be populated. For additional data input information, see EQuIS Data Tables and Fields.
Example Output: View the following example or contact EarthSoft Support.