|
<< Click to Display Table of Contents >> Navigation: EQuIS Library > Reports > Standard Reports > Graphs > Analyte Aggregate vs Location Plot (2d, 3d or Bubble) |
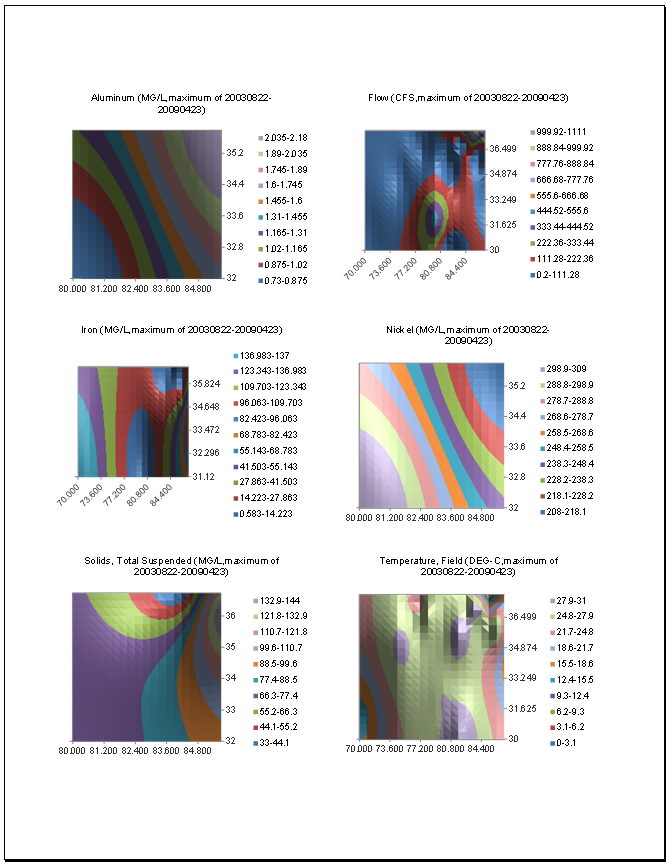
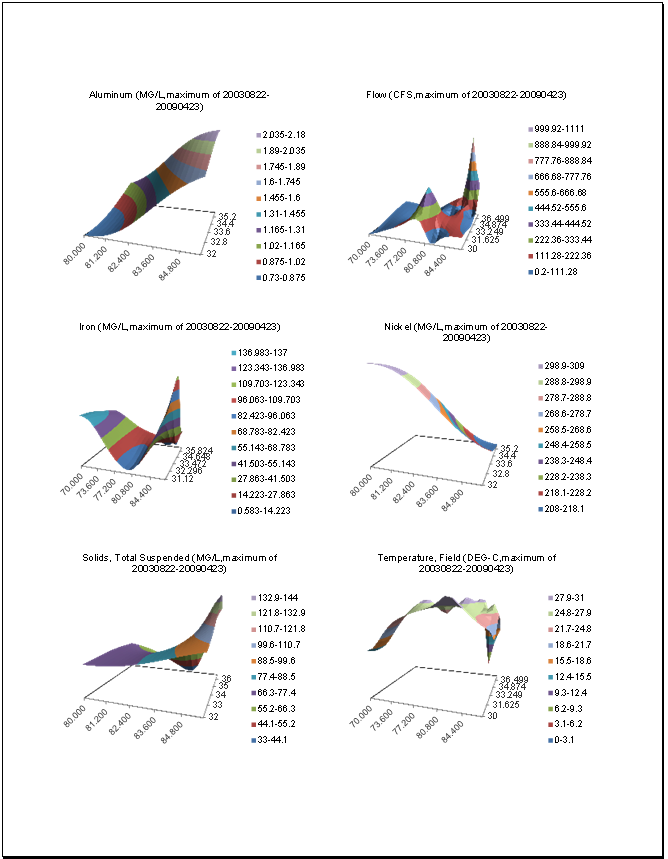
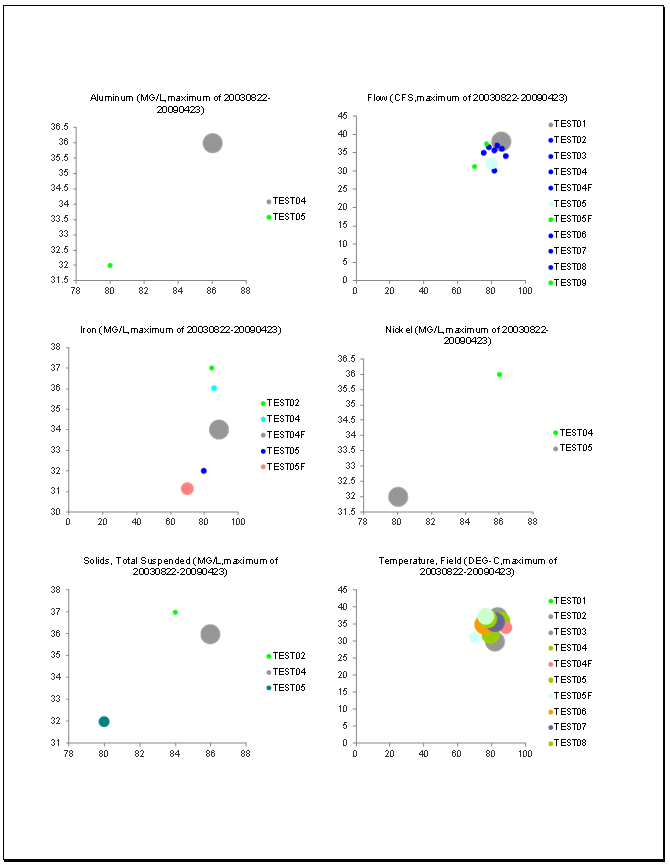
Report Name: Analyte Aggregate Vs. Location Plot (2d, 3d or Bubble) (example1: 2D) (example2: 3D) (example: bubble)
File Name: EarthSoft.Reports.Library.53583.dll
Report Dependencies: Analytical Results (Aggregate)
Software: EQuIS Professional and EQuIS Enterprise
Source: EQuIS Professional install
Language: English
Output Type: Excel1
Description: The Analyte Aggregate Vs. Location Plot (2d, 3d or Bubble) generates surface 2d contour, surface 3d, or a bubble chart of an aggregation (max, min, avg or sum) of the selected analyte(s) vs. locations. The report uses a saved analytical reports result or a user report.
Installation Instructions: This report assembly is part of the EQuIS Professional installation. No additional installation steps are necessary.
Overview:
The report also relies on the Analytical Results (Aggregate) (EQuIS function/Procedure Report). Some features are:
•Plots can be grouped or placed in one or multiple worksheets by analyte
•The number of plots per Excel print page can be defined as 1, 2, 3, 4, and 6
•Different units of a parameter, if available, are automatically converted to the latest sample unit and any results with failed unit conversions are removed to seamlessly generated plots.
Tables: ST_USER_REPORT and all tables used by the Analytical Results Report.
Report Parameters * |
||||||||||||||||||||||
|---|---|---|---|---|---|---|---|---|---|---|---|---|---|---|---|---|---|---|---|---|---|---|
|
||||||||||||||||||||||
* This report includes hidden parameter, The number of intervals in x axis and add Walls for 3d plots, that could affect the output
Consult an EQuIS administrator if these parameters should be visible or use different default values in a published report (a report
|
Report Output |
|---|
The output of this report is an Excel workbook with 2D, 3D, or Bubble plots. |
1Excel report output requires a valid license of Microsoft Excel to view the output.
Copyright © 2026 EarthSoft, Inc. • Modified: 30 Oct 2022