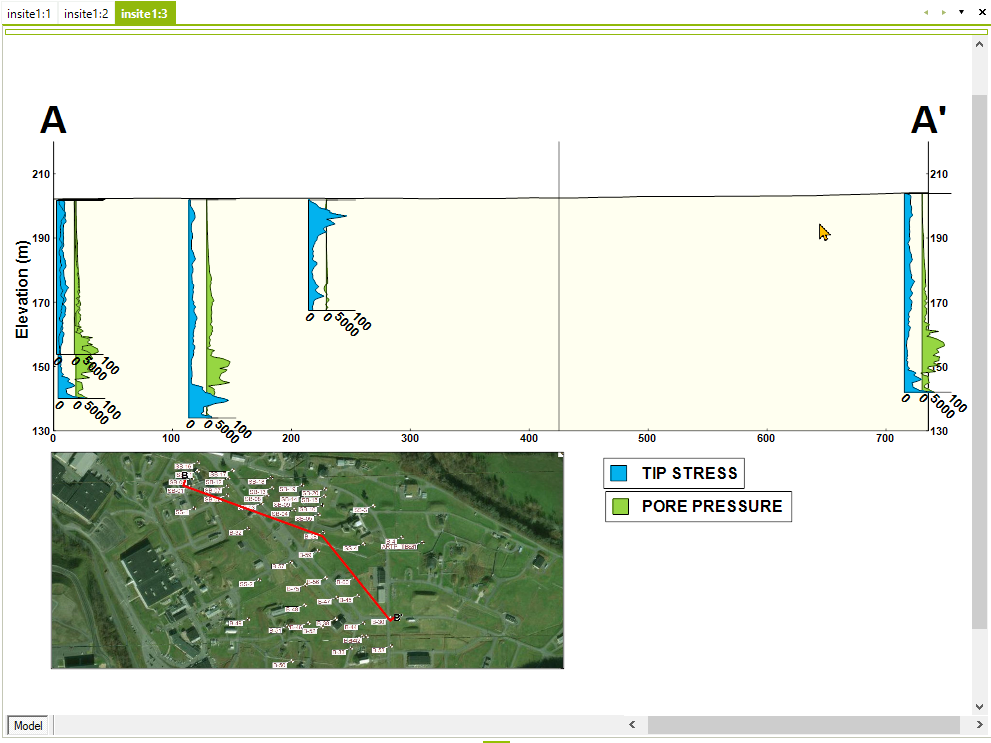
Profile charts are ideal for downhole plotting of geophysical data. Click Plot> Data from the main menu and select Profile Chart. The FormProfileChart dialog box opens. Modify the properties of the profile chart plot on the following tabs as desired, then click the OK button to save changes:
View a training video on creating a Profile Chart here.
|
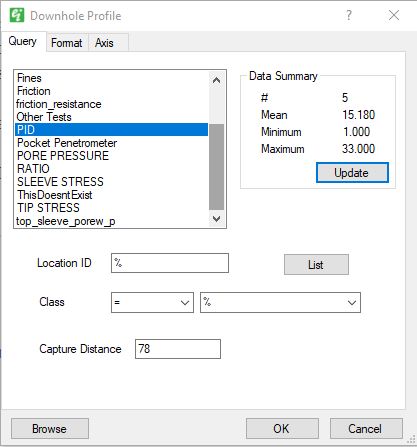
Constituent List: Select one constituent whose values will be plotted. Only constituents with a Media field value of "Point Values" in the Constituents table are listed for selection. Statistics associated with the selected constituent will be displayed in the Data Summary box. Location ID: Select well(s) to be plotted. Class: Select class field value for filtering of well selection. Capture Distance: Set capture distance to define a query distance from the cross-section. |
|
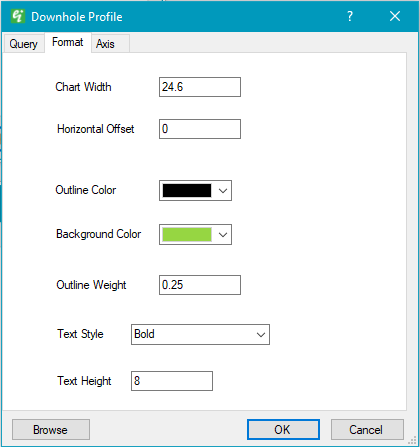
Chart Width: Set the plot width. Horizontal Offset: Offset of downhole value plot from location directly next to the location at which the sample is taken. Outline Color: Select the line color by clicking the color drop-down button and then choosing the desired color. Background Color: Select the background color by clicking the color drop-down button and then choosing the desired color. Outline Weight: Set the horizontal line thickness. Text Height: Specify text height. |
|
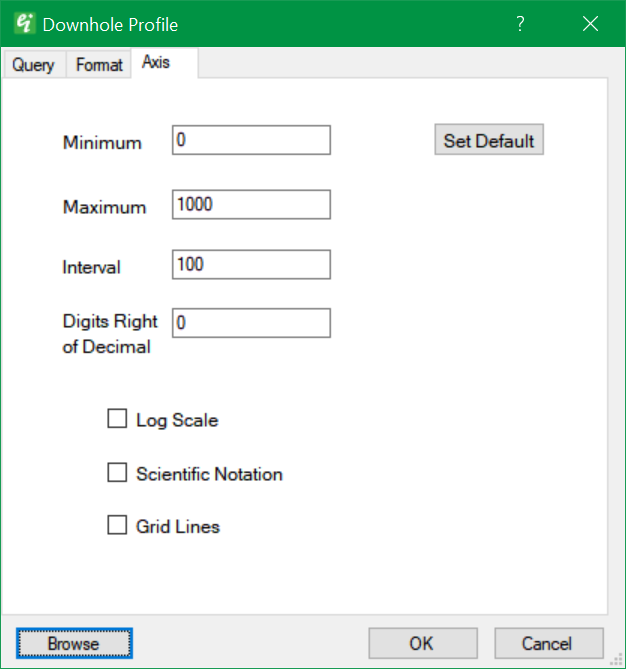
Minimum: Set the axis minimum. Maximum: Set the axis maximum. Interval: Specify numeric value between grid lines. Digits Right of Decimal: Set the number of digits right of the decimal to be included in the axis labels. Log Scale: Check to plot values using log transform of numeric values. Scientific Notation: Check to plot values on axis using scientific notation. Grid Lines: Check to plot grid lines.
|