Information on the geologic setting is stored in both the boring and stratigraphy data tables. Boring log data is intended for representation of the detailed lithologic and soils data as logged during the construction of a boring or well. The term geology refers to the local soil observations that are observable at a borehole scale. These observations are unlikely to be clearly continuous between boreholes. Stratigraphy is an interpretation of the geologic and/or hydrologic units that are of interest to hydrogeologists.
EnviroInsite now uses the EQuIS.Lithology function to calculate end_depth (bottom depth). EnviroInsite no longer calculates the end/bottom depth in the EI code. By convention, the bottom depth of all intervals, except for the lowermost interval, is simply the START_DEPTH of the underlying interval. The bottom depth of the lowermost interval for any location is taken to be the either the value of DT_LOCATION.TOTAL_DEPTH if that field is populated or the DT_WELL.DEPTH_OF_WELL for those locations where the TOTAL_DEPTH field is not populated. If neither DT_LOCATION.TOTAL_DEPTH or DT_WELL.DEPTH_OF_WELL fields are populated, then the calculated value of the bottom depth will be undetermined. The result of undetermined values of the bottom depth in plots that depend on its value is uncertain.
Profile and 3D boring plots show the detailed boring log information. In most cases, there is a need to present a consistent presentation style of formations and soil types on multiple profiles and 3D views. To facilitate this uniformity of soil presentation, the soil style is a document property, rather than being tied to a single graphic object. The color and pattern of a particular soil type can be changed by selecting Edit> Format> Geology from the main menu. The stratigraphic style is also a document property. To set the color and pattern of a particular stratigraphic style, select Edit> Format>Stratigraphy from the main menu. Existing boring or stratigraphic plot components will be automatically updated if the style format is changed.
The color and hatch definitions for either borings or stratigraphy may be saved to and restored from an external file for use in other projects. Select File> Export> Soils / Stratigraphy or File> Import> Soils / Stratigraphy to access these external files.
The properties to plot profiles based on either soil layers or regional stratigraphy are similar. The instructions provided below are for soils, but are also applicable to stratigraphy. To plot stratigraphic layers, click Plot> Stratigraphy from the main menu and select Logs. To plot soil layers, click Plot> Geology from the main menu and select Logs. The Borings dialog box opens. Modify the properties of the boring plot on the Query tab, Labels tab, Options tab, Format tab, and EQuIS Location Groups tab as desired. Click OK to save changes.
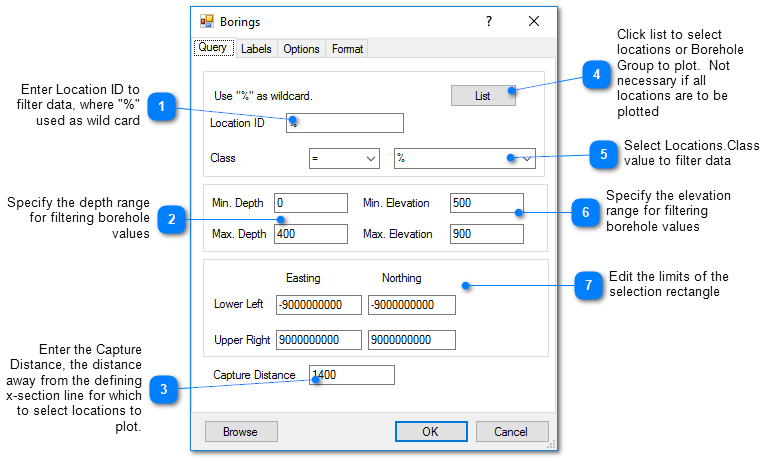
Query Tab
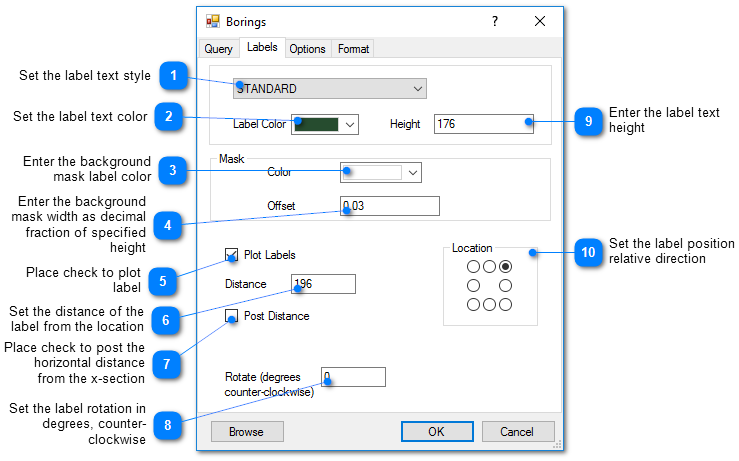
Labels Tab
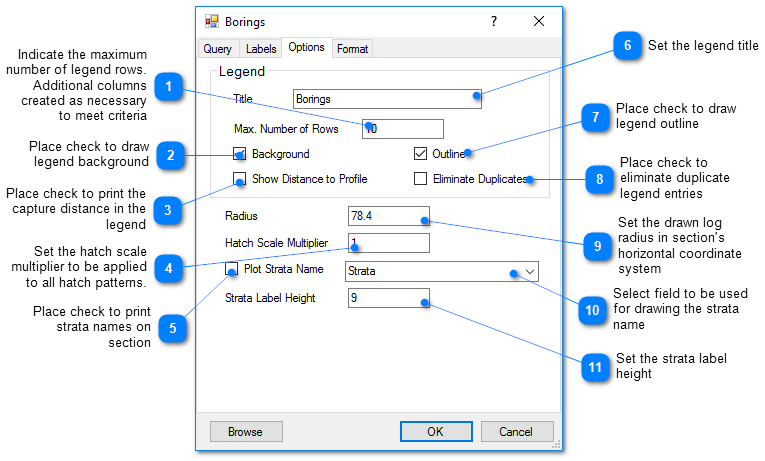
Options Tab
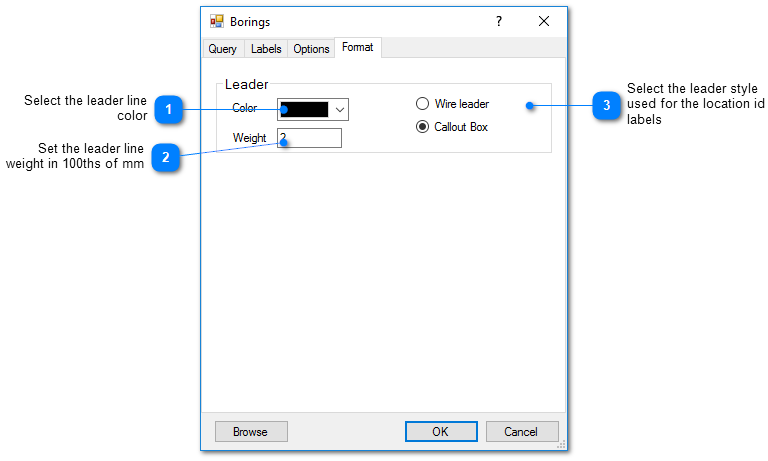
Format Tab