The EQuIS Live - Circular Gauge widget shows the latest real-time data retrieved from a selected series, as well as the minimum and maximum values it has captured. The widget will automatically update at set intervals (either user-specified, or based on DT_LOGGER.TRANSMIT_PERIOD_S).
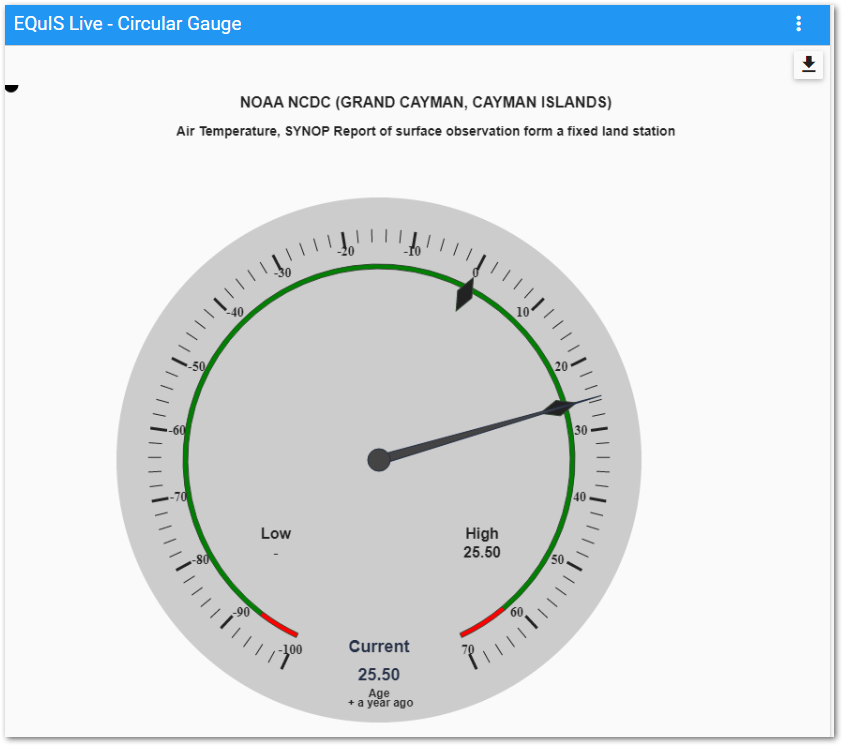
Download – Select the download icon to download the Live Circular Gauge as an image.
Widget Editor
To open the Widget Editor, select the More Options ![]() icon in the upper right corner of the widget to open the drop-down menu and then select the Edit menu option.
icon in the upper right corner of the widget to open the drop-down menu and then select the Edit menu option.
Widget Title – By default, the widget title is EQuIS Live - Circular Gauge. The title can be modified.
Widget Color – The color of the widget can be changed using the Change Widget Theme![]() icon to the left of the widget title.
icon to the left of the widget title.
Help – The Help ![]() icon connects to the online documentation related to the specific widget.
icon connects to the online documentation related to the specific widget.
Copy – Select the Copy Settings ![]() icon to to copy the settings from another widget of the same type. See the Copy Widget Settings article for more information.
icon to to copy the settings from another widget of the same type. See the Copy Widget Settings article for more information.
Cancel – Select the Close without Saving ![]() button to exit the Widget Editor without saving changes.
button to exit the Widget Editor without saving changes.
Save – Changes will be applied to the widget by clicking on the Save ![]() button. The Save button will become enabled once selections are made. The Widget Editor screen will close after the save operation is complete.
button. The Save button will become enabled once selections are made. The Widget Editor screen will close after the save operation is complete.
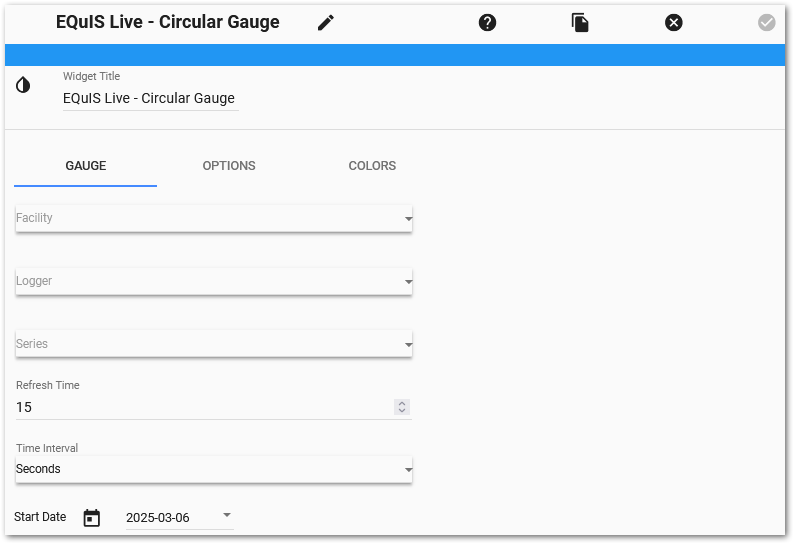
Gauge Tab
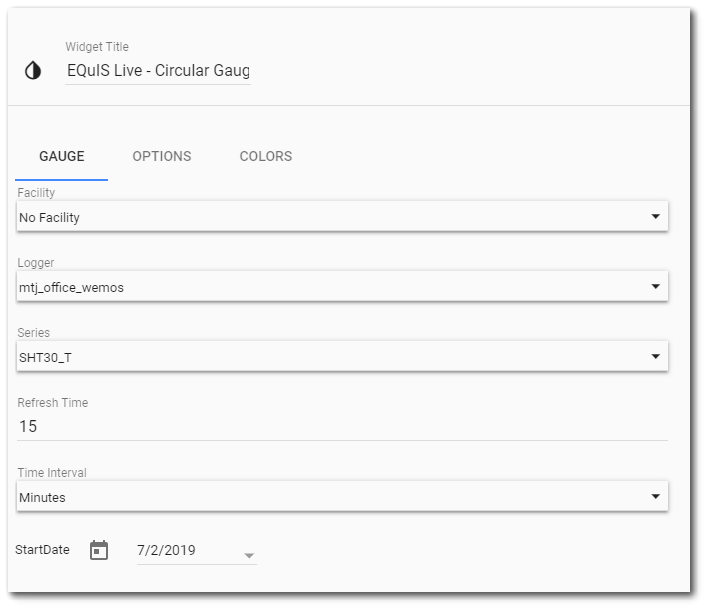
To add a logger series, make selections in the Gauge tab:
•Facilities – Select the facility for which the loggers should be chosen.
•Loggers – Select the logger to be tracked in the gauge.
•Series – Select the data series from the selected logger to display in the gauge.
•Refresh Time/Time Interval – Set the number and interval for the gauge to refresh (e.g., to get a 15-minute interval, set a Refresh Time of “15” and a Time Interval of “Minutes”, or set a Refresh Time of “900” and a Time Interval of “Seconds”).
•Start Date – User can select date and pull data from the same. If the start date is not specified, then all data is pulled.
Options Tab
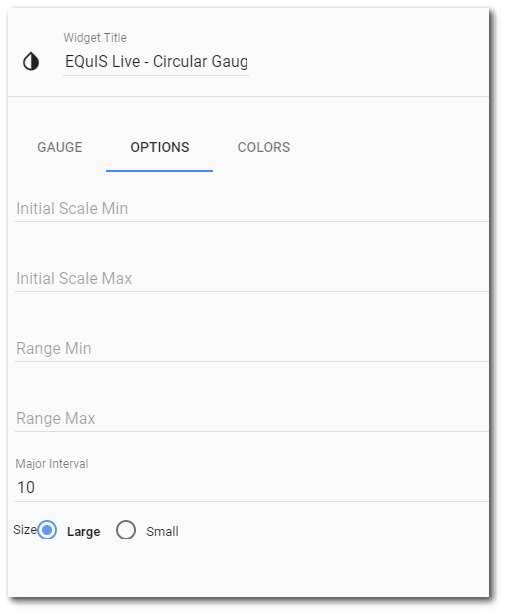
The Options tab has the following parameters:
•Initial Scale Min (optional) – Set the minimum value for the gauge scale. If a value is recorded below the minimum value, the gauge scale will update automatically with that value.
•Initial Scale Max (optional) – Set the maximum value for the gauge scale. If a value is recorded above the maximum value, the gauge scale will update automatically with that value.
•Range Min – Set this value to show when the series goes below an expected threshold; defaults to DT_LOGGER_SERIES TYPICAL_MIN_VALUE.
•Range Max – Set this value to show when the series goes beyond an expected threshold; defaults to DT_LOGGER_SERIES TYPICAL_MAX_VALUE.
•Major Interval – Set the major intervals on the gauge; defaults to 10.
•Size – Two sizes are available for the circular gauge: Large and small.
Colors Tab
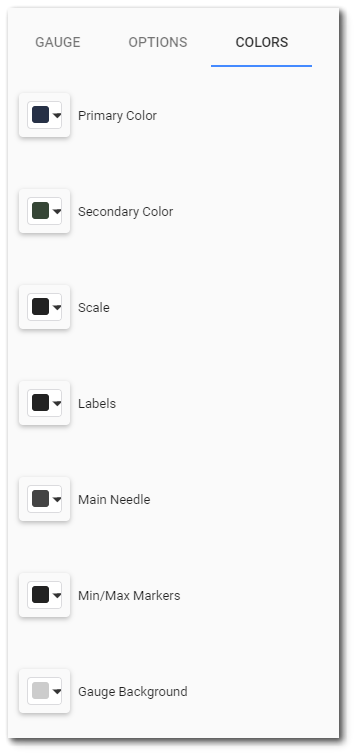
The Colors tab allows the user to select the colors for several of the gauge's following features:
•Primary – Select the colors for the Main Needle border and current value label.
•Secondary – Select various border colors.
•Scale – Select the color for the tick marks.
•Labels – Select the color for major tick values and other labels.
•Main Needle – Select the color for the Main Needle and cap.
•Min/Max Markers – Select the color for Minimum and Maximum markers.
•Gauge Background – Select the color for the gauge background.