|
<< Click to Display Table of Contents >> Navigation: EQuIS Library > Reports > Standard Reports by Product > Standard with EnviroInsite > EnviroInsite Stiff Diagram |
Report Name: EnviroInsite Stiff Diagram (example)
File Name: EarthSoft.Reports.Library.EnviroInsite.dll
Dependencies: Licensed EnviroInsite Module and template in DT_FILE (see below)
Software: EnviroInsite
Source: EnviroInsite install
Language: English
Output Type: *.pdf, *.svg, *.dxf, *.dwg, *.shp, *.emf, *.wmf, *.png, *.jpg, *.tif, *.vds, or *.vdml
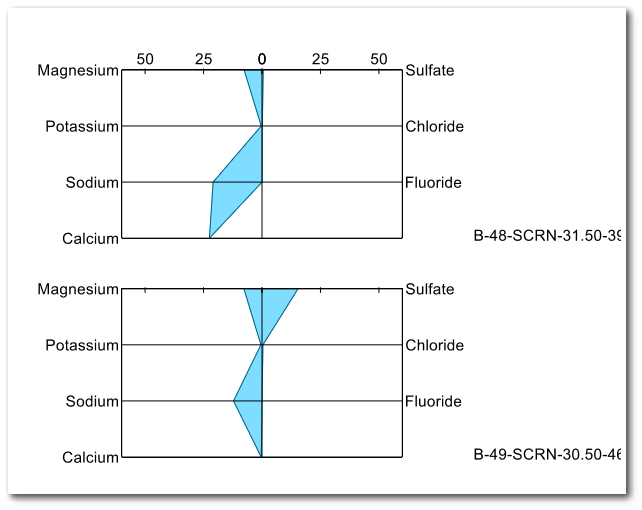
Description: The EnviroInsite Stiff Diagram Report produces a conventional Stiff diagram for a set of user-selected anions and cations and exports the result to a vector or image graphics file.
Installation Instructions: See the EnviroInsite Report Installation article for more detailed information.
For EQuIS Professional, a local installation of EQuIS EnviroInsite 7 is required to run the report.
Note: Using versions of EnviroInsite and Professional on the same machine that are not aligned can produce an 'evaluation' version of the report output. This occurs when using: •A version of EnviroInsite >7.23.2 and a version of Professional <7.23.2 •A version of EnviroInsite <7.23.3 and a version of Professional > 7.23.2 |
For EQuIS Enterprise and ArcEQuIS, additional files must be added to the Enterprise bin folder. The required files are packaged (EnviroInsite_Enterprise_package_x64_{#}.zip) and available on the EarthSoft Community Center Downloads page (All Items\Products\EnviroInsite\v7). An EnviroInsite Decision Support license must be present as a valid entry in the ST_LICENSE table.
ArcEQuIS also requires that the report be published to the database in EQuIS Professional.
Overview:
Concentrations of cations and anions are converted from mass to milliequivalents (meq) based on the entered values of equivalent weight in populated RT_ANALYTE_DETAIL.EQUIVALENT_WEIGHT fields. Only analytes for which RT_ANALYTE_DETAIL.EQUIVALENT_WEIGHT has been populated will be available for selection within the report. EnviroInsite expects that the equivalent weight of anions will be entered as negative quantities, while cations will carry positive equivalent weight values. For additional information on Stiff Diagrams using EnviroInsite, see the online help article, Stiff Diagram - Chart.
Note: An error will occur if chemicals are selected more than once as an Anion or Cation in the EnviroInsite Stiff Diagram Report. |
Report Parameters |
||||||||||||||||||||||||||||||||||||||||||||||||||||||||||||||||||||||||||||||||||||||
|---|---|---|---|---|---|---|---|---|---|---|---|---|---|---|---|---|---|---|---|---|---|---|---|---|---|---|---|---|---|---|---|---|---|---|---|---|---|---|---|---|---|---|---|---|---|---|---|---|---|---|---|---|---|---|---|---|---|---|---|---|---|---|---|---|---|---|---|---|---|---|---|---|---|---|---|---|---|---|---|---|---|---|---|---|---|---|
|
Copyright © 2026 EarthSoft, Inc. • Modified: 13 Oct 2024