|
<< Click to Display Table of Contents >> Navigation: EQuIS Library > Reports > Standard Reports by Product > Standard with Collect > Collect – API: Depth to Water Report |
Report Name: Collect – API: Depth to Water (example)
File Name: EarthSoft.Reports.Library.149680.dll
Dependencies: Licensed Collect Module
Software: EQuIS Collect, EQuIS Enterprise
Source: EQuIS Collect install
Language: English
Output Type: Report Grid1; JSON if used as a service
Description: The Depth to Water report is designed to provide water level data via Application Programming Interface (API) requests over HTTPS using EQuIS Authentication.
Installation Instructions: This report requires a licensed EQuIS Collect module and the Collect Schema applied to the database. For use, this report should be published to the database. Download the EQuIS Collect xcopy zip from the community center, unblock the *.zip file, and extract the EarthSoft.Reports.Library.149680.dll files to the EQuIS Professional installation folder. For default installations, this directory is C:\Program Files\EarthSoft\EQuIS\. The report will be available for selection once it has been published.
Overview:
The report can be utilized in the Collect mobile app by setting up a “Service” field in a Form Template. This field calls the API and returns a JSON file that includes location, unit, and depth to water range (maximum and minimum). The JSON also includes a set of coordinates (GEO_LOCATION) that enables the plotting of the location on a map within Collect. The data returned are found based on the date range and percentage outlier settings specified in the report parameters. The Historical Range Outlier parameter dictates what percentage of outlier data should be removed from the export. The default outlier value is 10%. See "How Collect Calculates Historical Ranges" later in this article for more details on how outliers are calculated.
Note: The water level depth unit of measurement should be consistent for each location. |
|---|
This report requires that more than one record per location in the DT_WATER_LEVEL table; DT_COORDINATE.COORD_TYPE_CODE set to ‘%LAT%LON%’ and .IDENTIFIER matching the Coordinate Identifier parameter required to export coordinates.
Note: The API: Depth to Water Report uses the DT_WATER_LEVEL.WATER_LEVEL_DEPTH field for water level values. |
|---|
Tables: DT_WATER_LEVEL, DT_COORDINATE
Report Parameters |
||||||||||||||||||
|---|---|---|---|---|---|---|---|---|---|---|---|---|---|---|---|---|---|---|
|
Report Output |
|---|
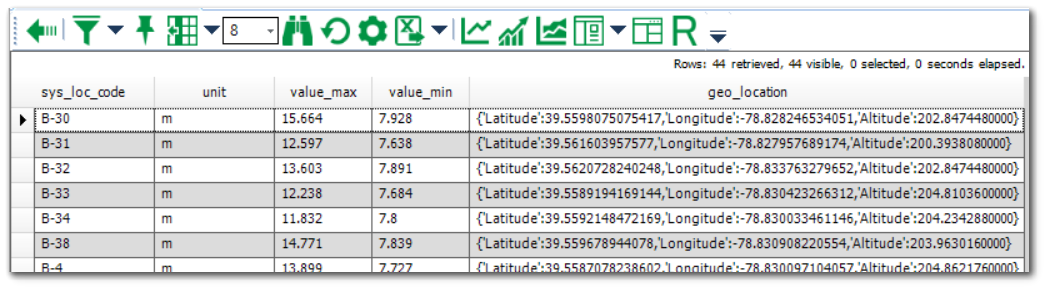
SYS_LOC_CODE UNIT VALUE_MAX VALUE_MIN GEO_LOCATION |
Configure as Webservice: Follow the steps in Collect Enterprise Setup for Internal Service from API Service Fields in Collect to setup the API to be used in Collect mobile.
1The Report Grid provides additional export options to Excel, Google Earth, Outlook, Shapefile, PDF, Text, Access, XML, or a printer.
How Collect Calculates Historical Ranges:
Collect uses statistics to calculate historical ranges that exclued outlier data, using the following formula:
R must fall between (Mean - X*STDEVP) and (Mean + X*STDEVP), where R is the water level and the X values are determined from the user's input in the Historical Range Outlier parameter.
% Under Normal Distribution |
Report Parameter |
X Value |
|---|---|---|
100% |
0% |
7 |
99% |
1% |
2.275829 |
95% |
5% |
1.959964 |
90% |
10% |
1.644854 |
80% |
20% |
1.281552 |
70% |
30% |
1 |
50% |
50% |
.067449 |
The Historical Range Outlier is set to 5% and there are 15 water level readings recorded for a location.
Number of Readings |
Depth to Water |
|---|---|
1 |
44.2 |
2 |
48 |
3 |
48.2 |
4 |
49.2 |
5 |
49.2 |
6 |
49.3 |
7 |
49.3 |
8 |
49.3 |
9 |
49.3 |
10 |
49.8 |
11 |
50.1 |
12 |
50.2 |
13 |
50.5 |
14 |
51 |
15 |
55 |
Assume that any data that do not lie under 95% of the area of the normal distribution should be excluded. The calculation follows:
Mean = 49.5
X*STDEVP = 4.136
Historical Range = between 45.4 and 53.6
The values 44.2 and 55 fall outside the range and will be excluded from the report.
Copyright © 2026 EarthSoft, Inc. • Modified: 08 Feb 2023