Report Name: Analytical Results with Sample Calculations (Table) (example)
File Name: EarthSoft.Reports.Library.11472.dll
Dependencies: Analytical Results II
Software: EQuIS Professional and EQuIS Enterprise
Source: EQuIS Professional install
Language: English
Output Type: Report Grid1
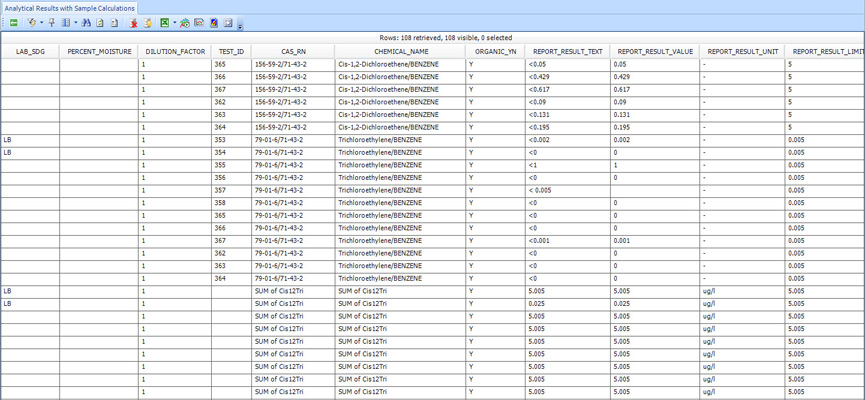
Description: The Analytical Results with Sample Calculations (Table) Report generates the results of the Analytical Results, and the results from the calculations of balance and summation of the results of the Analytical Results.
Installation Instructions: This report assembly is part of the EQuIS Professional installation. No additional installation steps are necessary.
Overview:
Balance Calculation
The report creates a new record for each sample where the REPORT_RESULT_VALUE (also REPORT_RESULT_TEXT and REPORT_RESULT_LIMIT) equals the original REPORT_RESULT_VALUE divided by the REPORT_RESULT_VALUE of the balance analyte from the same sample, which is defined by FACILITY_ID and SAMPLE_ID. No new rows are added if no balance value is entered or not found in the result.
Sum Calculation
The report creates a new record for each sample where the REPORT_RESULT_VALUE (also REPORT_RESULT_TEXT and REPORT_RESULT_LIMIT)
equals the sum of the results of the analytes for the same sample defined by FACILITY_ID and SAMPLE_ID, where the analytes are selected over
user interface by either individual or groups. No new rows are added if the analytes to be summed are not selected.
Summed values including non-detects (NDs) will vary based on the ND multiplier selection in the report parameters because this will change the REPORT_RESULT_VALUE for each non-detect.
The detect_flag value of a sample summary row can be a single value for representing detects or non-detects if the detect_flag values of all the sample results are the same, e.g. detect_flag = Y or N etc., or a string reflecting all the detect_flag values if the sample results have various detect_flag values, e.g. detect_flag = 3 Y(s), 1 N(s) which indicates the detect_flag value of 3 of the 4 sample results is Y and the rest is N.
Notes: •It is suggested that RT_MTH_ANL_GROUP_MEMBER.REPORTING_UNITS be used for the result analyte selection of beta AR so that all the units of the results are the same for the purpose of doing the calculations of balance and summation. •If RT_MTH_ANL_GROUP_MEMBER.REPORTING_UNITS is not used, the report does the unit conversions below. A) The units of all analytes are unified to the unit of balance analyte if balance calculation is carried out. B) The units of all the analytes to be summed are unified to the unit that is the latest (by SAMPLE_DATE) of one summed analyte. If multiple analyte groups are selected, the latest one unit is defined from the all selected analyte groups. •If both By Analyte and By Analyte Group of Sample Summary are selected, the latter is ignored. •All the rows with unit conversion errors or REPORT_RESULT_VALUE=99999999 are removed from the final report results. •All other columns except for REPORT_RESULT_VALUE, REPORT_RESULT_TEXT and REPORT_RESULT_LIMIT are populated based on the attached Analytical Results_Calculations Report Development spreadsheet. |
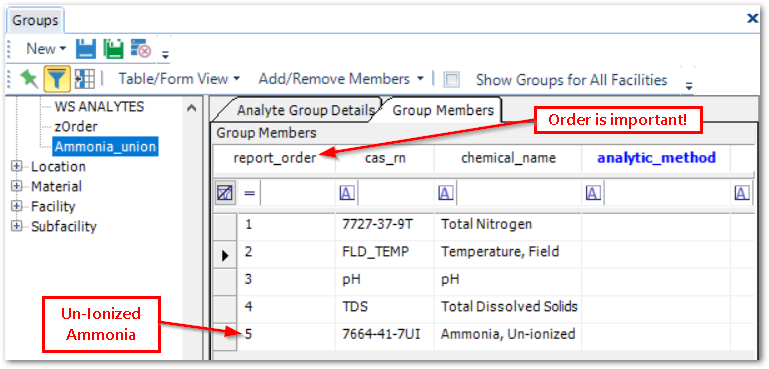
Un-ionized Ammonia Calculation
The report can compute the Ammonia (Un-ionized Ammonia) based on values of Total Ammonia, Temp C, pH and TDS. Note the Ammonia_union below is the analyte group name for Un-ionized Ammonia as shown in the image below. The report result value of Ammonia is calculated by the equations below.
Calculation Equations:
Assume p1-p4 are values of Total Nitrogen, Temp C, pH and TDS
H = 0.09018 + 2729.92 / (p2 + 273.2)
L = 0.000025 * p4
M = 87.74 - 0.4008 * p2 + 0.0009398 * p2 ^ 2 - 0.00000141 * p2 ^ 3
N = 1824830 * (M * (p2 + 273.16)) ^ -1.5
O = -(L * N) ^ 0.5 / (1 + L ^ 0.5)
P = (1 / (1 + 10 ^ (H - p3 - O)))
report_result_value for the Un-ionized Ammonia = Math.Round((p1 * P), decimals)
Tables: DT_SAMPLE/TEST/RESULT, RT_GROUP, RT_GROUP_MEMBER, RT_MTH_ANL_GROUP
Report Parameters |
||||||||||||||||||||||||||||||||||||||||||||||||||||||||||||||||||||||||||||
|---|---|---|---|---|---|---|---|---|---|---|---|---|---|---|---|---|---|---|---|---|---|---|---|---|---|---|---|---|---|---|---|---|---|---|---|---|---|---|---|---|---|---|---|---|---|---|---|---|---|---|---|---|---|---|---|---|---|---|---|---|---|---|---|---|---|---|---|---|---|---|---|---|---|---|---|---|
|
Report Output |
||
|---|---|---|
FACILITY_ID FACILITY_CODE SYS_LOC_CODE LOC_NAME SAMPLE_ID SYS_SAMPLE_CODE SAMPLE_NAME SAMPLE_DATE SAMPLE_TYPE_CODE START_DEPTH END_DEPTH DEPTH_UNIT MATRIX_CODE TASK_CODE PARENT_SAMPLE_CODE ANALYSIS_LOCATION LAB_SAMPLE_ID LAB_MATRIX_CODE LAB_NAME_CODE ANALYTIC_METHOD |
ANALYSIS_DATE COLUMN_NUMBER FRACTION TEST_TYPE PREP_METHOD LEACHATE_METHOD LEACHATE_DATE LAB_SDG PERCENT_MOISTURE DILUTION_FACTOR TEST_ID CAS_RN CHEMICAL_NAME ORGANIC_YN REPORT_RESULT_TEXT REPORT_RESULT_VALUE REPORT_RESULT_UNIT REPORT_RESULT_LIMIT REPORTABLE_RESULT DETECT_FLAG |
INTERPRETED_QUALIFIERES VALIDATOR_QUALIFIERS LAB_QUALIFIERS QUANTITATION_LIMIT METHOD_DETECTION_LIMIT REPORTING_DETECTION_LIMIT DETECTION_LIMIT_UNIT APPROVAL_CODE RESULT_TEXT RESULT_NUMERIC RESULT_UNIT RESULT_TYPE_CODE X_COORD Y_COORD Z_COORD_AVG ZFROM ZTO LONGITUDE LATITUDE |
1The Report Grid provides additional export options to Excel, Google Earth, Outlook, Shapefile, PDF, Text, Access, XML, or a printer.