Report Name: Action Level Exceedance II - Percent Variance
File Name: EarthSoft.Reports.Library.51729.dll
Dependencies: Saved Analytical Results II Report
Software: EQuIS Professional and EQuIS Enterprise
Source: EQuIS Professional install, EQuIS Enterprise install
Language: English
Output Type: Excel1
Description: The Action Level Exceedance II - Percent Variance report is designed to flag analytical results within a given EDD that vary by more than the listed percentage from the historical average for each chemical and location, and is primarily used as an EQuIS Information Agent (EIA), or trigger within EQuIS Enterprise.
Installation Instructions: This report assembly is part of the EQuIS Professional installation. No additional installation steps are necessary.
Overview:
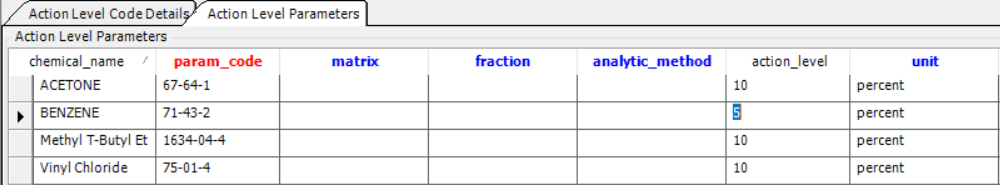
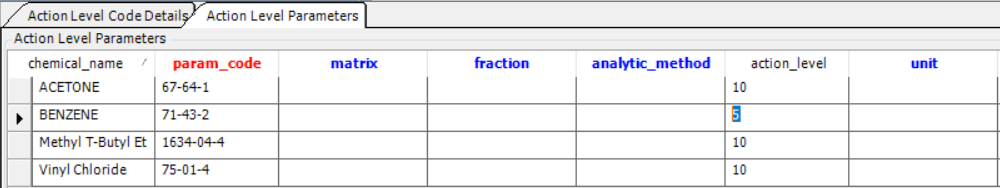
The allowable percentage of variation is listed for each chemical in DT_ACTION_LEVEL_PARAMETER. An action_level and action_level_min are calculated by adding and subtracting the percentage amount from the average of the historical result values for each location.
The EDD selected in report parameters calls the records in DT_SAMPLE with a matching EBATCH. The report will only return data if all samples within that EBATCH have locations assigned (i.e. there are no null DT_SAMPLE.SYS_LOC_CODE fields).
In addition, the report can be run as an EQuIS Information Agent (EIA) as each new EDD is loaded (see EZView for information on setting a report up as an EIA).
Source Tables DT_ACTION_LEVEL, DT_ACTION_LEVEL_PARAMETER, DT_LOCATION, DT_SAMPLE, DT_SUBFACILITY, DT_TEST, RT_GROUP, ST_REPORT, ST_USER_REPORT, DT_SAMPLE, DT_TEST, ST_EDD_BATCH, ST_REPORT, ST_USER_REPORT, DT_RESULT, DT_SAMPLE, DT_TEST, ST_EDD_BATCH, FACILITY_ID, FACILITY_CODE, SYS_LOC_CODE, LOC_NAME, SAMPLE_ID, SYS_SAMPLE_CODE, SAMPLE_NAME, SAMPLE_DATE, SAMPLE_TYPE_CODE, START_DEPTH, END_DEPTH, DEPTH_UNIT, MATRIX_CODE, TASK_CODE, PARENT_SAMPLE_CODE, ANALYSIS_LOCATION, LAB_SAMPLE_ID, LAB_MATRIX_CODE, LAB_NAME_CODE, ANALYTIC_METHOD, ANALYSIS_DATE, COLUMN_NUMBER, FRACTION, TEST_TYPE, PREP_METHOD, LEACHATE_METHOD, LEACHATE_DATE, LAB_SDG, PERCENT_MOISTURE, DILUTION_FACTOR, TEST_ID, CAS_RN, CHEMICAL_NAME, ORGANIC_YN, REPORT_RESULT_TEXT, REPORT_RESULT_VALUE, REPORT_RESULT_UNIT, REPORT_RESULT_LIMIT, REPORTABLE_RESULT, DETECT_FLAG, INTERPRETED_QUALIFIERS, VALIDATOR_QUALIFIERS, LAB_QUALIFIERS, QUANTITATION_LIMIT, METHOD_DETECTION_LIMIT, REPORTING_DETECTION_LIMIT, DETECTION_LIMIT_UNIT, APPROVAL_CODE, RESULT_TEXT, RESULT_NUMERIC, RESULT_UNIT, RESULT_TYPE_CODE, X_COORD, Y_COORD, Z_COORD_AVG, ZFROM, ZTO, LONGTITUDE, LATITUDE, LOC_GROUP_CODE, LOC_REPORT_ORDER
Report Parameters |
||||||||||||||||||||||||||||||||||||||||||||||||||||||||||||
|---|---|---|---|---|---|---|---|---|---|---|---|---|---|---|---|---|---|---|---|---|---|---|---|---|---|---|---|---|---|---|---|---|---|---|---|---|---|---|---|---|---|---|---|---|---|---|---|---|---|---|---|---|---|---|---|---|---|---|---|---|
|
Variance Parameters:
The historical result average is determined from the Variance input parameters:
Number of Results: Count of results to include in the historical average calculation, starting from the most recent within the specified date range.
Start/End Dates: The sample date range of results used to determine the historical result average.
Action Level(s): An action level must be selected for the report to run. For this report, only one action level may be selected. The other Action Level parameters work as in the other Action Level Exceedance II reports.
Variance Calculations:
Example Percent Variance Action Level:
The report action_level and action_level_min are calculated as follows:
action_level = result average + (percent * result average)
action_level_min = result average - (percent * result average)
In this example, the calculations would look like this:
|
Example Percent Variance Action Level |
||
|---|---|---|---|
SYS_LOC_CODE |
RESULT_AVERAGE |
ACTION_LEVEL_MIN |
ACTION_LEVEL |
B-30 |
15.67 |
15.67 - (0.05 * 15.67) = 14.9 |
15.67 + (0.05 * 15.67) = 16.5 |
B-31 |
15.31 |
15.31 - (0.05 * 15.31) = 14.5 |
15.31 + (0.05 * 15.31) = 16.1 |
B-32 |
0.0 |
0.0 + (0.05 * 0.0) = 0.0 |
0.0 + (0.05 * 0.0) = 0.0 |
Example Action Level without "percent" or "%" in the DT_ACTION_LEVEL_PARAMETER.UNIT:
In this example, the calculations would look like this:
|
Example Action Level without "percent" or "%" in the DT_ACTION_LEVEL_PARAMETER.UNIT |
||
|---|---|---|---|
SYS_LOC_CODE |
RESULT_AVERAGE |
ACTION_LEVEL_MIN |
ACTION_LEVEL |
B-30 |
15.67 |
15.67 - 5 = 10.7 |
15.67 + 5 = 20.7 |
B-31 |
15.31 |
15.31 - 5 = 10.3 |
15.31 + 5 = 20.3 |
B-32 |
0.0 |
0.0 - 5 = -5.0 |
0.0 + 5 = 5.0 |
Comparison of the two different calculation results:
|
Example Percent Variance Action Level |
Example Action Level without "percent" or "%" in the DT_ACTION_LEVEL_PARAMETER.UNIT |
|||
|---|---|---|---|---|---|
SYS_LOC_CODE |
RESULT_AVERAGE |
ACTION_LEVEL_MIN |
ACTION_LEVEL |
ACTION_LEVEL_MIN |
ACTION_LEVEL |
B-30 |
15.67 |
14.9 |
16.5 |
10.7 |
20.7 |
B-31 |
15.31 |
14.5 |
16.1 |
10.3 |
20.3 |
B-32 |
0.0 |
0.0 |
0.0 |
-5.0 |
5.0 |
Notes: •A summary of calculations are recorded in alp_remark consisting of Variance, Average of Values and Number of Values. •If the number of historical results in the date range specified is less than the entered number for an EDD result, the alp_remark of the output will show how many historical results were used in the calculations. •If the number of historical results in the date range specified is more than the entered number for an EDD result, the most recent historical results are used in the calculations. •The data of the selected EDD itself will never be used in the historical average calculation, even if the sample dates of the EDD are within the Variance date range. •The SYS_LOC_CODE, CAS_RN and MATRIX_CODE of the EDD results are used to find matching historical results. |
1Excel report output requires a valid license of Microsoft Excel to view the output.