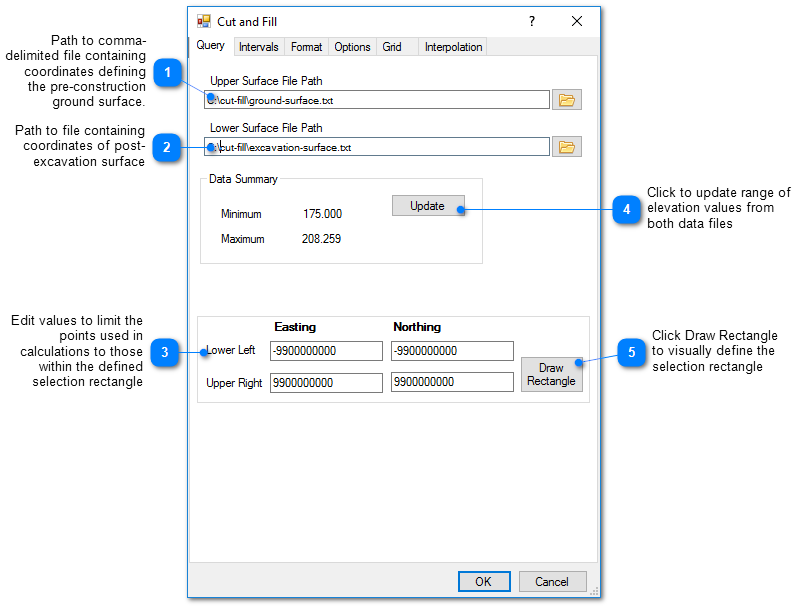
The cut-and-fill feature contours the distance between two surfaces and evaluates the volume between those surfaces for each of the specified contour intervals. An example application of this feature is to use EnviroInsite to draw contours of an excavation depth and calculate the volume of excavated soil based on a comparison to pre-existing conditions. The source data for the calculations is provided in two data files representing the upper and lower surface. The upper surface typically would be the existing ground surface and the lower surface would be the proposed post-excavation surface. The source data files are space- or comma-delimited text files, where each line contains the horizontal coordinates and the surface elevation—one point per record.
The cut-and-fill calculations are carried out by Monte Carlo integration. Essentially, a set of randomly selected points within the domain are selected. The surface elevation and post-excavation values are interpolated at these points based on the entered data and the volume is estimated based on the difference between these elevations and the representative area. The user may select either kriging or inverse distance as the interpolation method. The number of points is incrementally increased over a number of iterations to ensure that the method has converged on a stable estimate. Results are presented in the Output tab of the Work Log window. Results may be copied by highlighting the summary table and selecting CTRL-C. These values may be easily pasted into an Excel table.
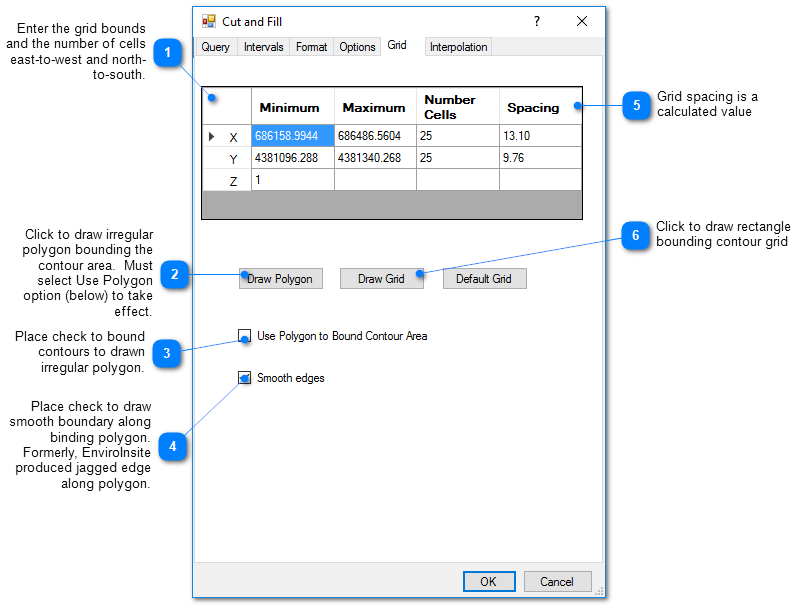
To perform cut-and-fill calculations, click Plot> External Data from the main menu and select Cut-and-Fill. The Cut and Fill dialog box opens. Modify the properties on the following tabs as desired:
Click the OK button to save changes.
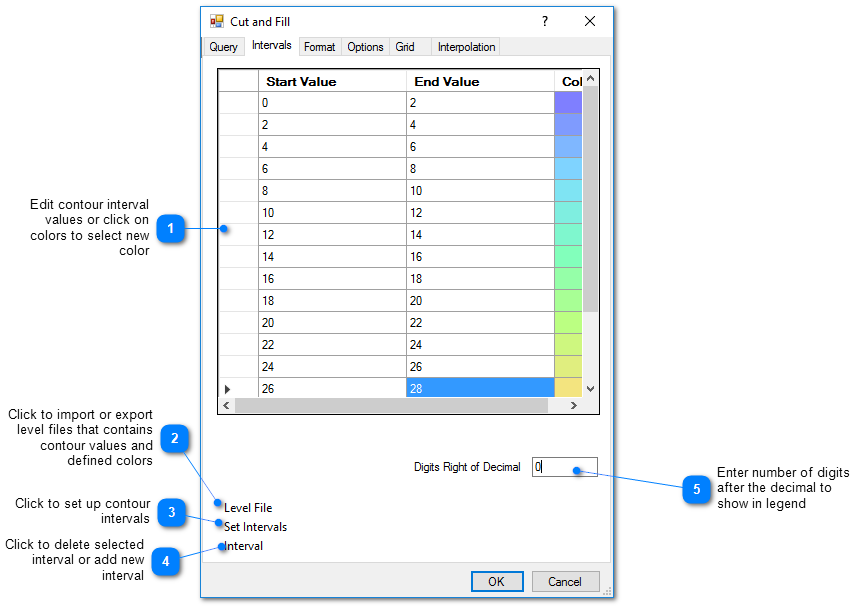
Enter the desired contour intervals. At a minimum, a single interval should be specified that extends from zero to a maximum value that is equivalent to the maximum excavation depth.
This tab allows the user to select the interpolation scheme and the parameters of the interpolation method. The correct selection of interpolation parameters is critical to generate contours that accurately reflect the field data and our expectations of how the values vary between the measured data points. The default parameters are frequently adequate, although some improvement can be anticipated through trial and error. There is no single, objectively optimal set of interpolation parameters. Different methods and parameters work best for different data sets.
Method: Select the contouring method from inverse distance, kriging, natural neighbor, and triangulation.
Search Limit
Radius: The cutoff distance establishes the maximum distance from the interpolated point for which a measured value will be used in the interpolation function. Used by both kriging and inverse distance routines.
Default Value for Points Outside Search Radius: This is the default value for points within the grid that are interpolated because they lie outside the search radius or outside the user-defined polygon from the Grid tab.
Use Default: Specify whether or not to use the default value. If not selected, then the non-interpolated nodes will not be contoured.
Kriging Parameters
The kriging routines are derived from the kt3d routine of the Geostatistical Software Library (GSLIB) authored by Clayton Deutsch and Andre Journel.
Variogram Model: Select from the spherical, exponential, gaussian, power, and hole variogram models using conventions of GSLIB.
Sill: Set the variogram model sill or c value.
Nugget: Set local scale variability.
Range a max: Set maximum horizontal range.
Range a min: Set minimum horizontal range.
Range a vert: Set vertical range.
Angle: Rotation angle in degrees clockwise about 12 o'clock of axis defining the direction of maximum horizontal range. In some cases it may be advantageous to increase the a max value and to align this axis with the direction of ground-water flow.
Inverse Distance Parameters
Z Scale: The vertical distances are multiplied by this value prior to calculating the interpolation weight assigned to a measured value. Z Scale values greater than one will result in lower weights assigned to measured values that are not at the same elevation as the grid point.
Exponent: The measured values are assigned weights that are equal to one over the distance between the measured value and the grid point raised to some power. This exponent is the power used in that calculation.
Smooth Distance: The inverse distance method tends to cause a kind of bubbly surface with the bubbles coinciding with measurement points. This type of trend can be reduced by introducing a non-zero smoothing distance. The smoothing distance is effected by adding this distance to the separation distance between the measurement point and the grid point prior to calculating the interpolation weight.