The Dashboard Chooser allows the user to find and view other dashboards that they have permissions to view. For dashboards that have a facility selected, the permissions are checked against the facility permissions. Click on the Choose Dashboard ![]() button on the dashboard header to open the Dashboard Chooser.
button on the dashboard header to open the Dashboard Chooser.

Interface and Viewing Options
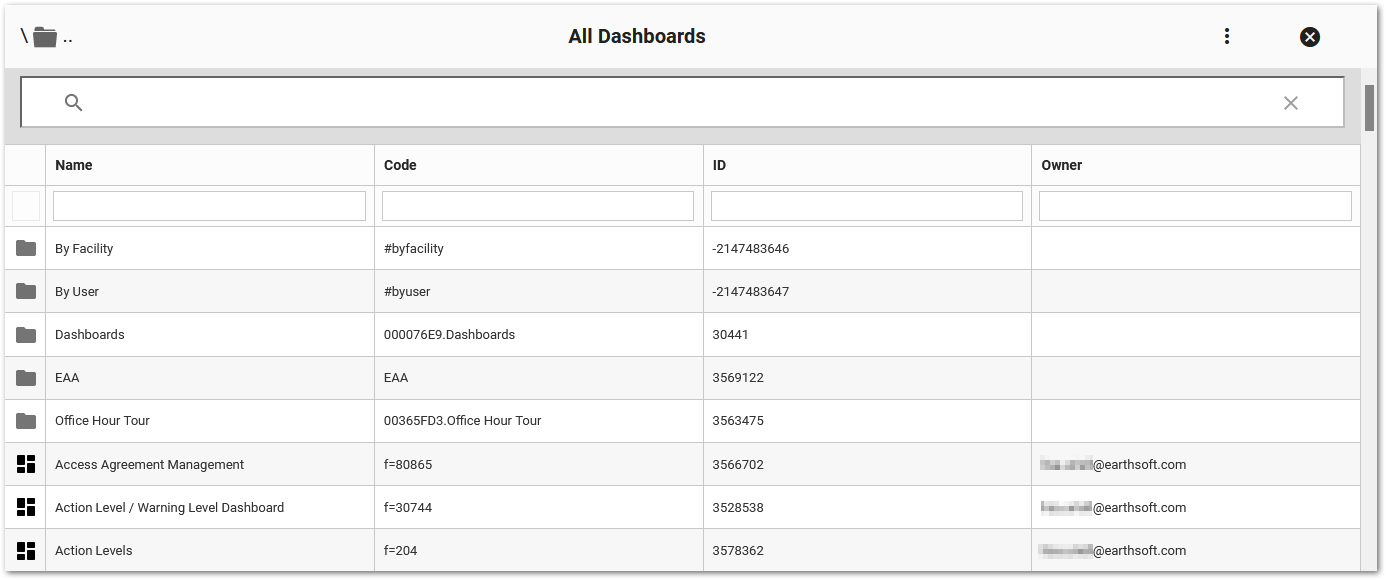
In the upper left corner of the Dashboard Chooser, the folder structure is displayed and indicates the level at which the user has drilled down, as shown below:
![]()
Close Dashboard Chooser – The ![]() icon closes the Dashboard Chooser without changing the selected dashboard.
icon closes the Dashboard Chooser without changing the selected dashboard.
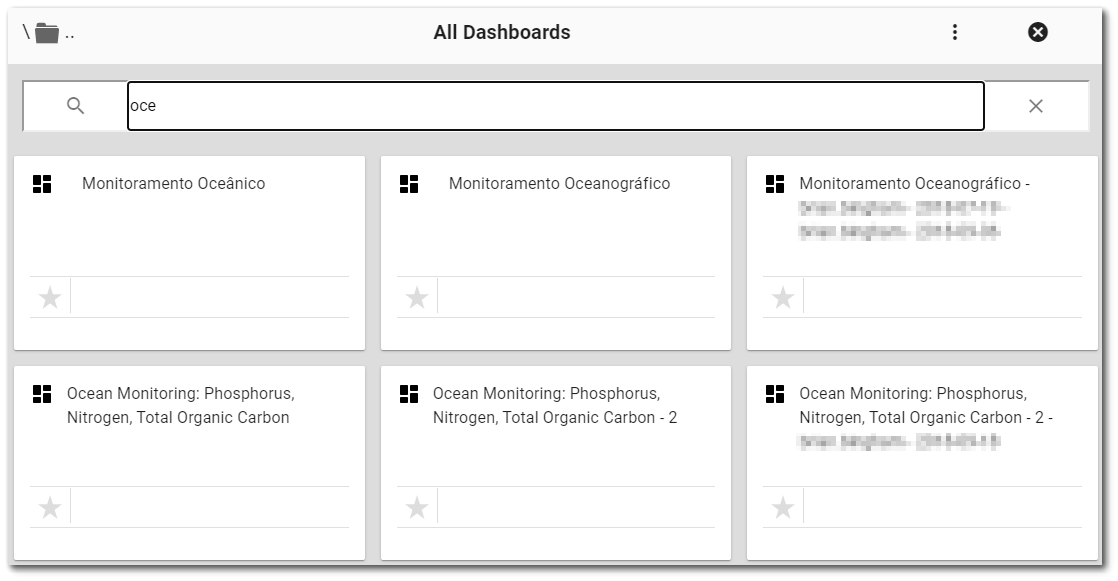
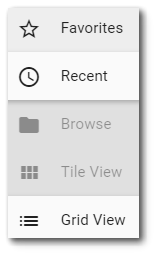
The Dashboard Chooser provides a variety of options to view and select dashboards. Select the More Options Favorites – Lists the user's favorite dashboards. Favorite dashboards are selected in tile view by clicking the star on the tile. This will change the star to gold, and that dashboard will show up in the Favorites view. Recent – Lists recently used dashboards, sorted in reverse chronological order (most recently used appearing first). Browse – Browse all dashboards accessible to the user. Tile View – Displays the dashboards as large tiles. In the tile view, the Dashboard Chooser will display two different icons: The Dashboard
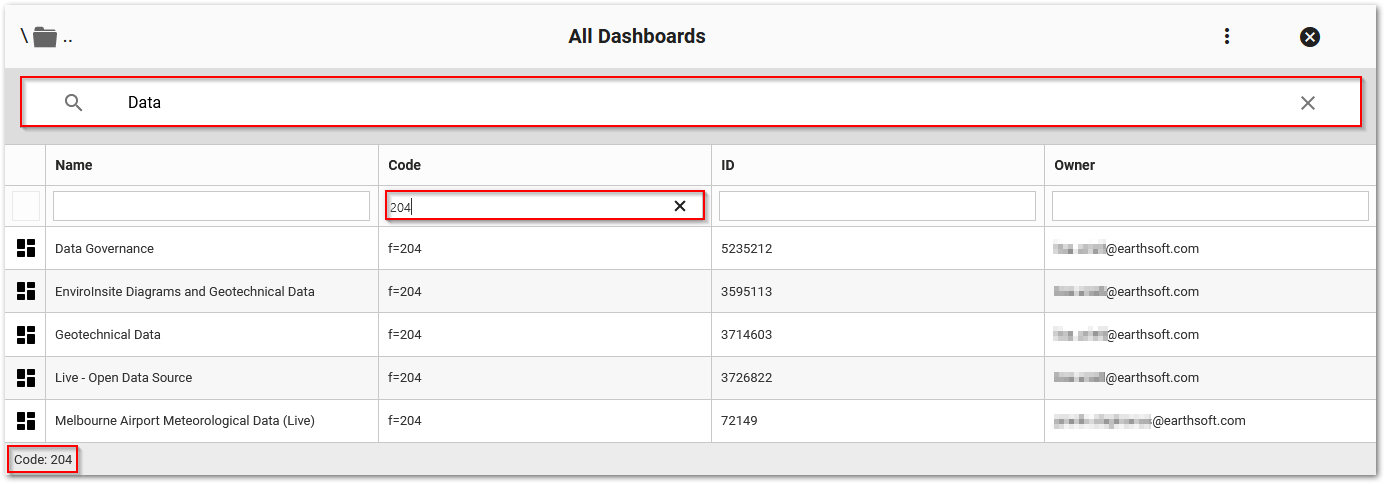
Grid View – Displays the dashboards in list form (default view). In addition to the dashboard name, this view displays the DASHBOARD_CODE, DASHBOARD_ID, and owner of the dashboard. The grid view offers a search bar at the top of the grid which is able to search for dashboards based on the input text, including in nested folders. The grid view also includes filter functionality by entering text into a text box field at the top of each column. Multiple fields can be filtered simultaneously by entering filter criteria in two or more columns. In the example below, a red highlight surrounds the text boxes where search and filter values are entered and shows the returned results when the term "Data" was entered in the search box and "204" was entered in the Code column. The current filter values are summarized in the bottom left corner, shown with a red highlight. The search and filter options can be used together or independently.
|
|
Once the desired dashboard is found, simply click on the tile to select the dashboard and close the Dashboard Chooser. To open another dashboard in a new browser tab, press the CTRL key and click on the desired dashboard. The Dashboard Chooser stays open.
Configuring a default dashboard, or adjusting how the available dashboards are displayed, can be done using the Application Settings section of the User Profile Editor.
Dashboard Search Capabilities
Search available dashboards by entering a text string into the search box ![]() below the Dashboard Chooser header. The display of dashboards will be limited to the search string. The Dashboard Chooser can search through all folders, including sub-folders. Users can either click the
below the Dashboard Chooser header. The display of dashboards will be limited to the search string. The Dashboard Chooser can search through all folders, including sub-folders. Users can either click the ![]() or use the "Enter" button on the keyboard to initiate a search. Clicking the
or use the "Enter" button on the keyboard to initiate a search. Clicking the ![]() icon at the end of the search box will clear the search and reset the user to the folder structure prior to the search.
icon at the end of the search box will clear the search and reset the user to the folder structure prior to the search.
Virtual Folders
The Dashboard Chooser contains two virtual folders to help organize dashboards: By Facility and By User. These folders list dashboards by facility and by dashboard creator, respectively.


