Subsurface Profile options may be modified by selecting Edit > Options from the Subsurface Profile Template Design window. The Log Plotter Options dialog box opens. Modify properties on the tabs as desired:
Click the OK button to save changes.
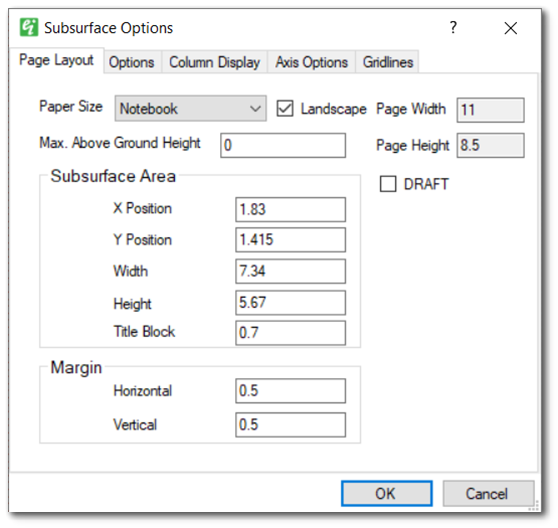
Paper Size – A drop-down menu that allows the user to select the page size. There are several standard options as well as a custom option. When selected, both the page height and page width will be displayed. When the custom option is selected, the user can manually enter a value for the page height and page width.
Landscape Checkbox – When checked, the page orientation will be set to landscape. When unchecked, the page orientation will be set to portrait.
Max. Above Ground Height – This specifies the above ground height shown on the log to display casings that stick up above the ground surface.
Subsurface Area – Set the X and Y position of the bottom left corner of the area, as well as the height and width of the subsurface area, in inches. The title block height is also specified in inches.
Margin – Page margins in inches.
Draft – When checked, the text "DRAFT" will be displayed diagonally across the center of the plotted subsurface profile.
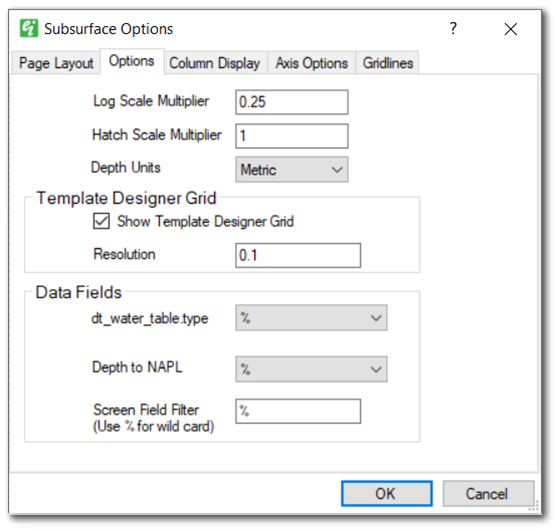
Log Scale Multiplier – Scales the columns and text displayed in the Subsurface Profile.
Hatch Scale Multiplier – All of the hatch patterns in the log are multiplied by this scale to provide for global control over the hatch pattern scales.
Depth Units – Indicates depth units displayed on the axes and other locations.
Template Designer Grid > Show Template Designer Grid – Check to show the grid in the Subsurface Profile Design window. All objects will snap to the grid points.
Template Designer Grid > Grid Resolution – Spacing of the grid points in the Subsurface Profile Design window.
Data Fields > Depth to Water (non-EQuIS database users) – Select data field from Wells table that will be used for display of depth to water. This field is used in the downhole plots, where the depth to water has been elected to be plotted.
Data Fields > DT_WATER_TABLE.TYPE (EQuIS users) – Select from the populated values of DT_WATER_TABLE.TYPE to select DT_WATER_TABLE records deemed to be representative of the depth to water. All water depth values are presumed to be relative to the top of casing elevation specified in DT_WELL.TOP_CASING_ELEV.
Data Fields > Depth to NAPL – Select data field from Wells table that will be used for display of depth to NAPL. This field is used in the downhole plots, where the depth to NAPL has been elected to be plotted.
Data Fields > Screen Field Filter – Field for selection of displayed screens. This allows only a subset of the Screens table records to be used in drawing the screen in the Well Construction downhole plots. This might be useful when records in the Screens table contain sample intervals from a soil boring.
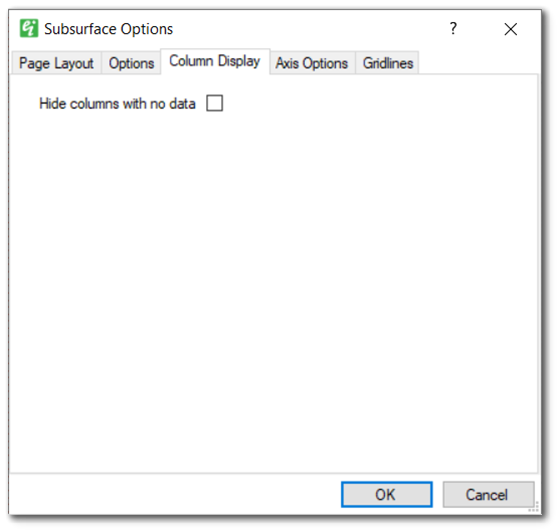
Hide columns with no data – When enabled, columns with no data across all selected wells will not draw in the resulting boring log output.
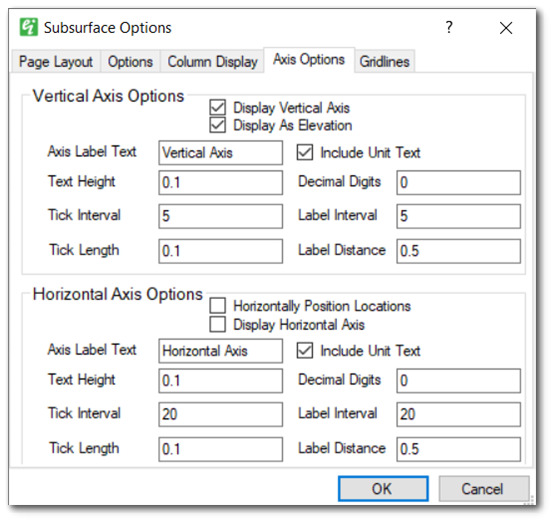
Vertical Axis Options
Display Vertical Axis – Check this box to automatically add a vertical axis to the subsurface profile output.
Display As Elevation – Check this box to display each of the locations according to its elevation.
Axis Label Text – Specify the text label of the axis.
Include Unit Text – Check to automatically append the units used to the end of the axis label.
Text Height – Set the size of the text displayed on the axis as well as the size of the axis label.
Decimal Digits – Specify the number of decimal places shown for the axis labels.
Tick Interval – Sets the spacing between the tick marks on the axis.
Label Interval – Sets the spacing between the labels on the axis.
Tick Length – Sets the length of the tick marks displayed on the axis.
Label Distance – Sets the width of the axis as well as the spacing between the axis and axis label.
Horizontal Axis Options
Horizontally Position Locations – When checked, the locations will be plotted based on a line between the two most distant locations selected.
Note: EnviroInsite reads the value of DT_FACILITY.COORD_TYPE_CODE and DT_FACILITY.IDENTIFIER to determine which coordinate information should be used from DT_COORDINATE for the location(s). |
Display Horizontal Axis – Check this box to automatically add a horizontal axis to the subsurface profile output. This option is only available if ‘Horizontally Position Locations’ is also checked.
Axis Label Text – Specify the text label of the axis.
Include Unit Text – Check to automatically append the units used to the end of the axis label.
Text Height – Set the size of the text displayed on the axis as well as the size of the axis label.
Decimal Digits – Specify the number of decimal places shown for the axis labels.
Tick Interval – Sets the spacing between the tick marks on the axis.
Label Interval – Sets the spacing between the labels on the axis.
Tick Length – Sets the length of the tick marks displayed on the axis.
Label Distance – Sets the width of the axis as well as the spacing between the axis and axis label.
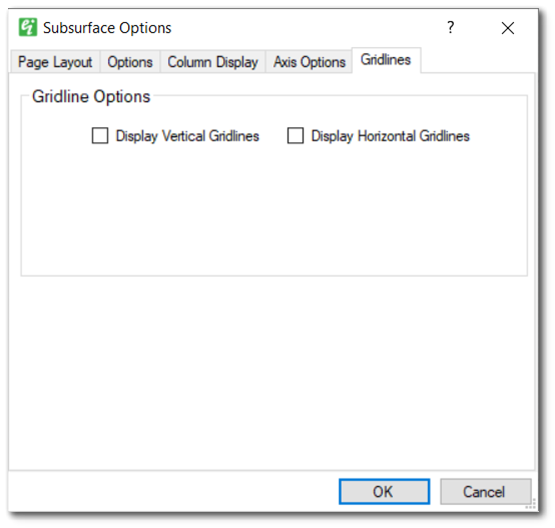
Display Vertical Gridlines – When checked, displays gridlines vertically at each horizontal axis tick mark. This option requires that ‘Horizontally Position Locations’ be checked on the Axis Options Tab.
Display Horizontal Gridlines – When checked, displays gridlines horizontally at each vertical axis tick mark.