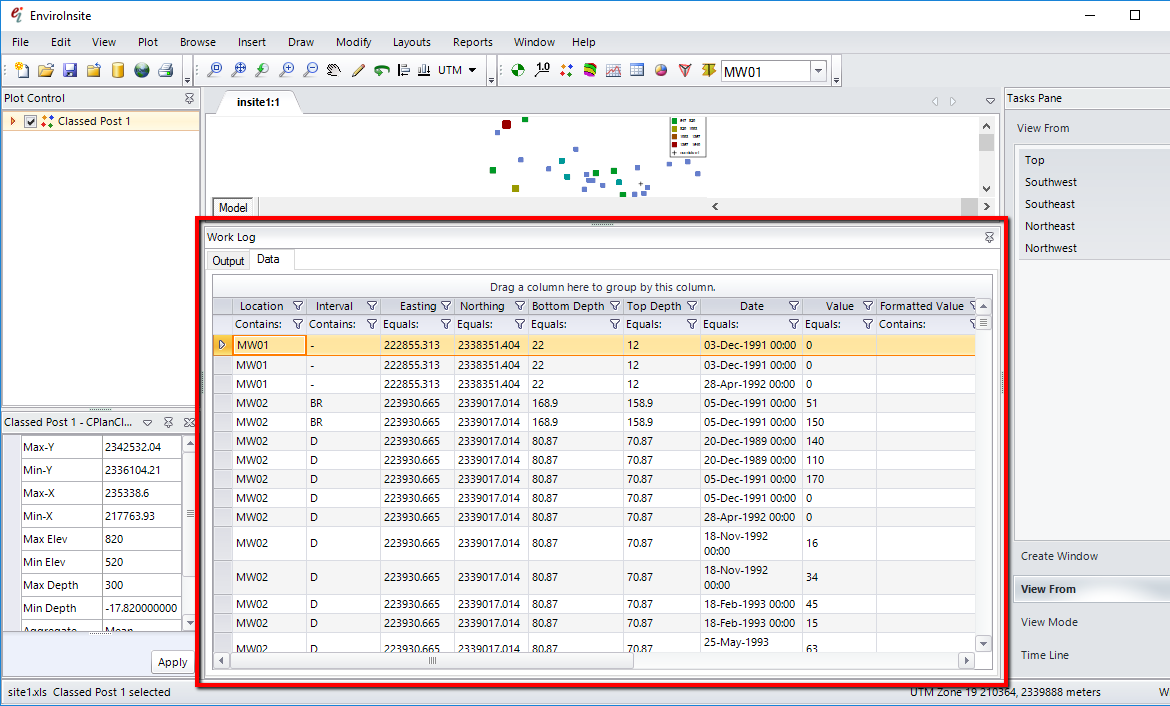
The Data tab is located in the Work Log window (below the View window), and contains the results of the query used to generate the selected plot object in the Plot Control panel. For instance, the data grid in the image below contains the data used to create the selected Classed Post object in the Plot Control panel. The size of the Work Log window has been expanded by grabbing the line above the window and dragging it upward.
Within the data grid, you can work with the dataset in a variety of ways.
•Copy and paste to Excel by right-clicking in the grid area and selecting Copy. Open Excel and paste the data.
•Print by right-clicking in the grid area and selecting Print.
•Filter data in the grid by clicking any one of the funnels in the column headers. Filter the data by selecting or removing checks at the values. Imposing a filter in the Data Grid will not result in a change to the query underlying the plotted image.
•Click in the cells where it says "Contains" and enter a value to search for.
•Click in any of the cells in the row below the column header and select from a list of options that allow you to filter the data in other ways.
•Sort the data by clicking in any of the column headers.
•Drag a column header to the allocated space above the grid to group by the cell contents in the dragged column.
The data grid can be turned off when queries select large datasets. From the main menu, select View> Active Grid. This will remove the check next to the Active Grid menu item and cause the Data Grid to not populate.