Box whisker charts depicts data through their quartiles. The top of the box represents the upper quartile and the bottom of the box represents the lower quartile. The median of the data is presented as a line through the box. The whiskers are the lines extending vertically from the box that indicate variability outside the upper and lower quartiles. Outliers may be plotted as individual points.
Box whisker plots are ideal for comparing distributions of data since the median, spread and overall range are immediately apparent. Within EnviroInsite, data can be charted by location or by constituent.
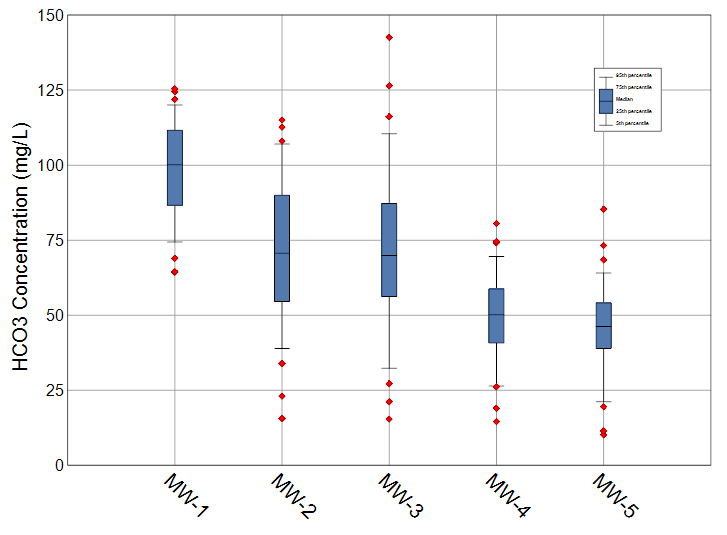
By Location
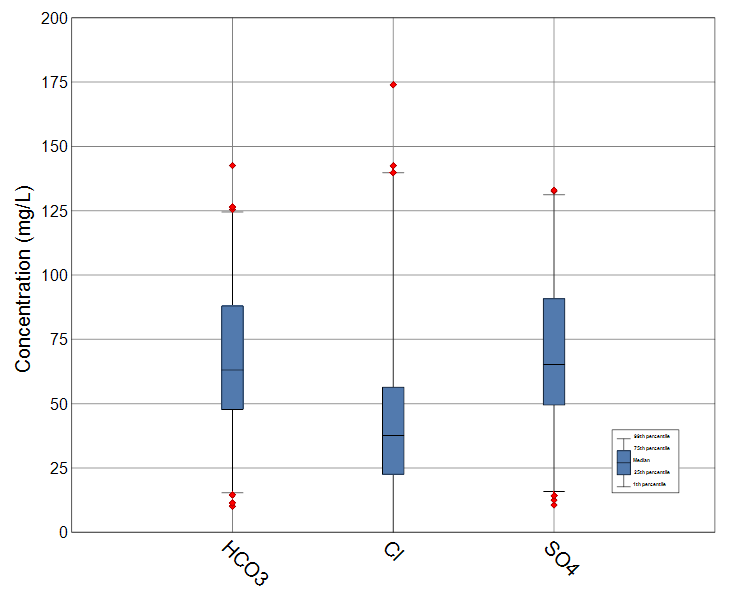
By Constituent
To create a box whisker chart, select Window> New> Charts from a plan view map. A new view window is generated. Select Plot> Box Whisker to open the Box Whisker dialog box. Modify the chart properties on the Query tab, Vertical Axis tab, Options tab, and Format tab as desired. Click the OK button to save changes.
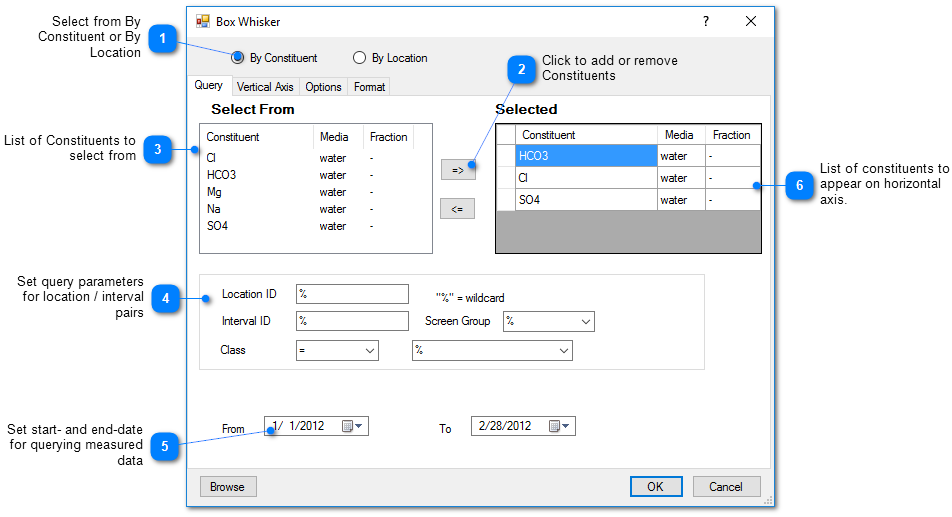
Query Tab
By Location Selected – Box Whisker shows statistics of samples of single analyte for a list of specified locations.
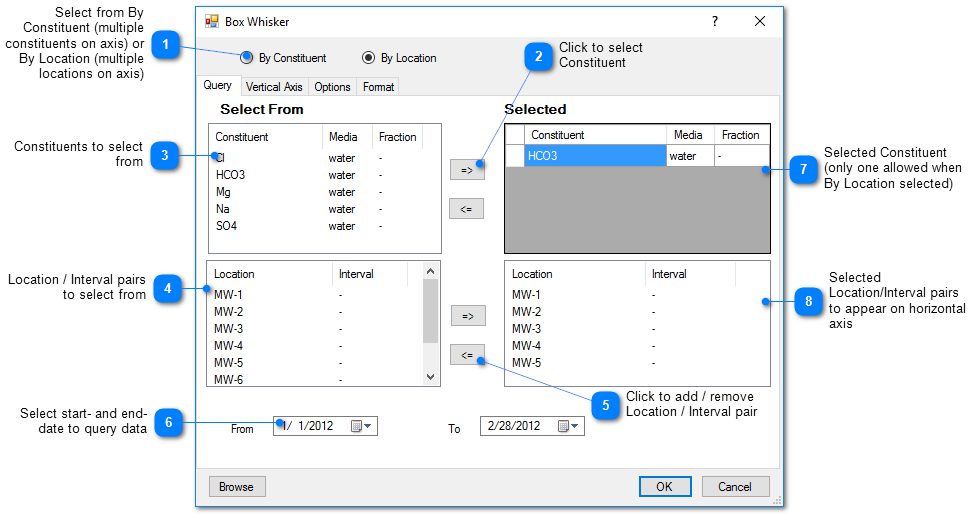
By Constituent Selected – Box Whisker shows statistics of samples at multiple locations for each specified constituent.
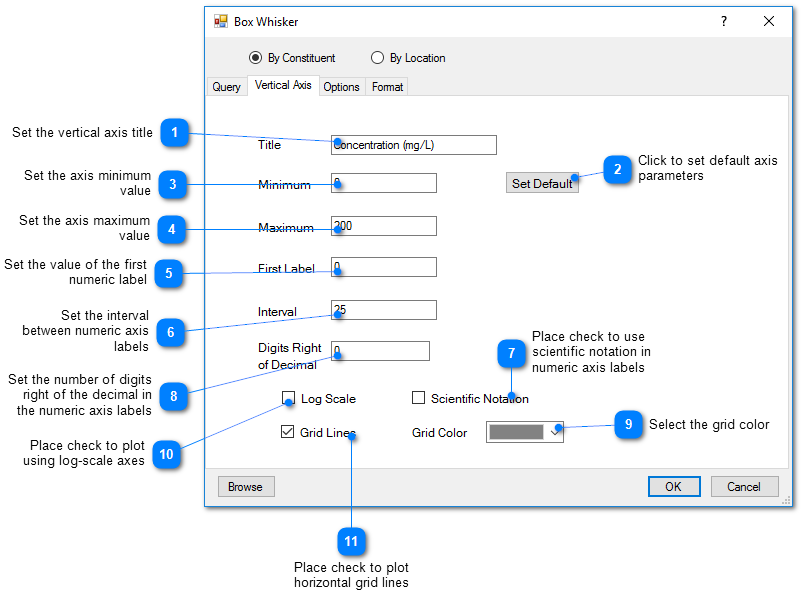
Vertical Axis Tab
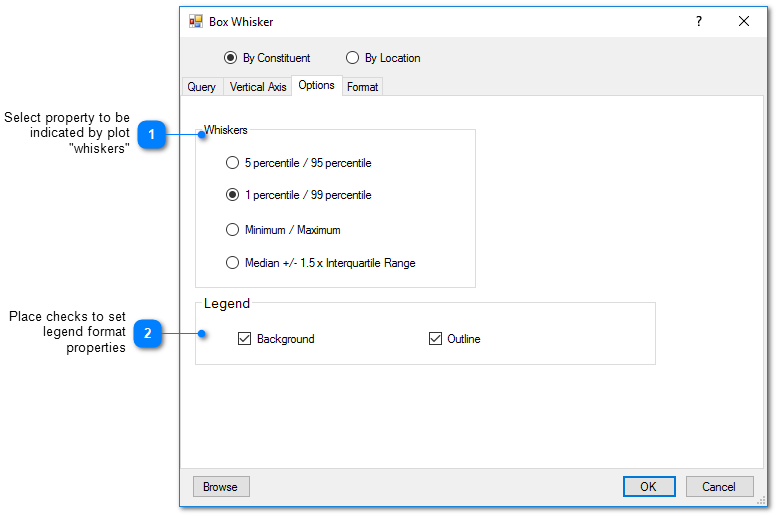
Options Tab