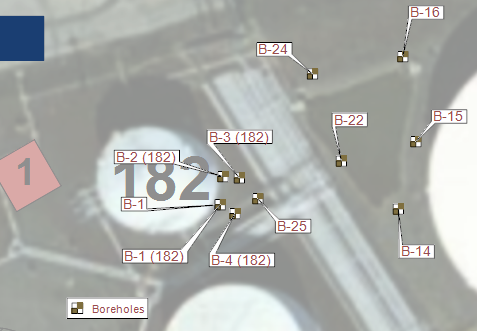
In plan view, wells are plotted with user-specified symbols. Data queries can select which locations are plotted depending on the location's horizontal coordinates, location ID, interval ID, screen elevation and depth. EnviroInsite automatically plots location labels on the plan view. Move location labels around the screen using a mouse.
If DT_FACILITY.X_MIN/MAX and Y_MIN/MAX are populated, then, by default, any locations with coordinates that are outside of this facility extent will not plot in EnviroInsite. To resolve this, update DT_FACILITY.X_MIN/MAX and Y_MIN/MAX to encompass those coordinate bounds.
Click Plot > 2D Data from the main menu and select Locations. The Locations dialog box opens. Modify the properties of the locations plot on the Query tab, Labels tab, Options tab, Format tab, and EQuIS Location Groups tab as desired. Click the OK button to save changes.
Note: EnviroInsite not only queries locations by coordinates but also by depth. The default range is set by:
•Maximum = maximum DT_COORDINATE.ELEV (or, if that is not populated, DT_WELL.TOP_CASING_ELEV) •Minimum = minimum DT_COORDINATE.ELEV minus DT_LOCATION.TOTAL_DEPTH (or if DT_LOCATION.TOTAL_DEPTH is not populated, it uses DT_WELL.DEPTH_OF_WELL).
If DT_WELL_SEGMENT.START_DEPTH/END_DEPTH fields are populated, be sure either DT_LOCATION.TOTAL_DEPTH or DT_WELL.DEPTH_OF_WELL is populated with values that are at least as great as the DT_WELL_SEGMENT.END_DEPTH for each location.
If DT_WELL.TOP_CASING_ELEV is populated, DT_COORDINATE.ELEV is required to plot locations. |
|---|
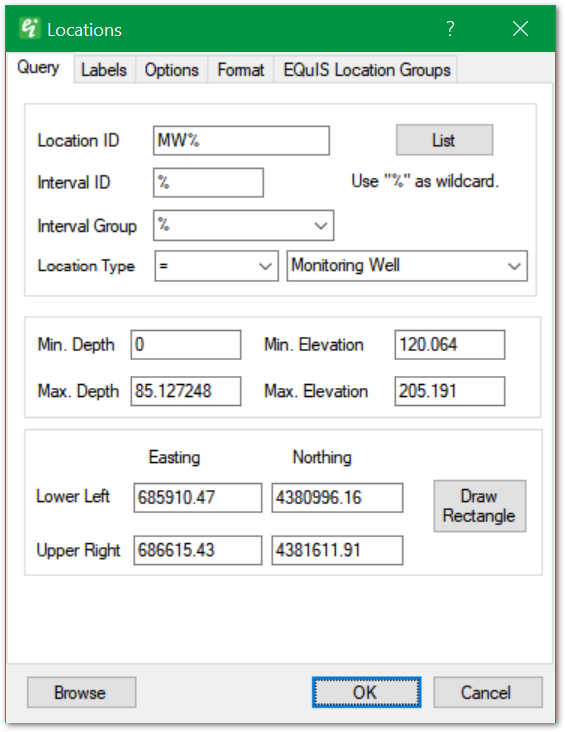
Use "%" as a wild card for text fields filtering locations.
Location ID – Enter value to filter by Location ID.
List – Click List button to select specific locations to be plotted. List does not need to be defined if all locations are to be plotted.
Interval ID – Enter value to filter by Interval ID.
Location Group – Select to filter by Interval Group value.
Location Type – Set to equal or exclude a specific location type.
Min. Depth and Max. Depth – Enter minimum and maximum depth values to filter by sample depth.
Min. Elevation and Max. Elevation – Enter minimum and maximum elevation values to filter by sample elevation. Query is based on the center of the sample interval.
Note: For minimum and maximum depth values, the following must be valid: Min. Depth <= Sample Start Depth <= Max. Depth OR Min. Depth <= Sample End Depth <= Max. Depth |
Coordinates (Lower Left/Upper Right and Easting/Northing) – Edit selection-rectangle coordinates, or click the Draw Rectangle button to redefine.
Draw Rectangle – Click Draw Rectangle button to visually define the selection-rectangle coordinates.
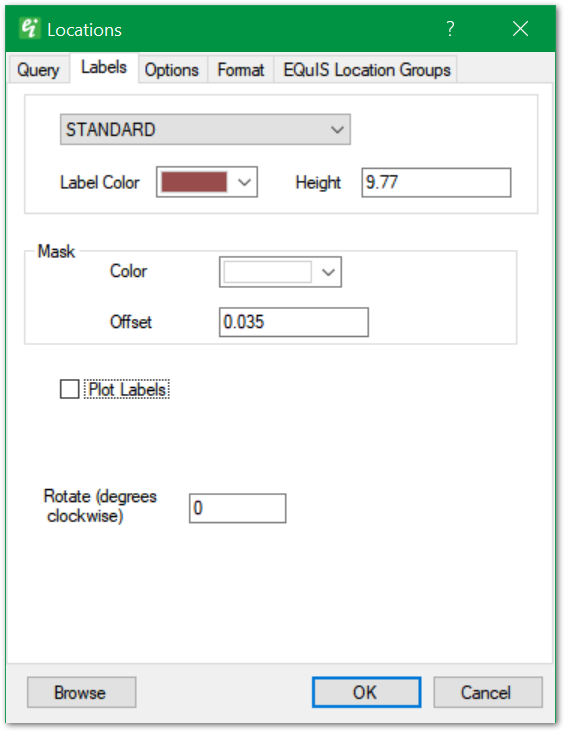
Label Text Style – Use the top drop-down to select the text style for lable. Text styles are defined as document properties.
Label Color – Select the label color.
Height – Enter text height in real-world coordinates.
Mask – The label's background mask is a font outline to enhance the visibility of text strings drawn over busy background images.
Color – Select background mask color.
Offset – Specify the mask width, expressed as a fraction of the specified text height.
Plot Labels – Check to plot Location ID labels.
Rotate – Specify the label rotation in degrees clockwise.
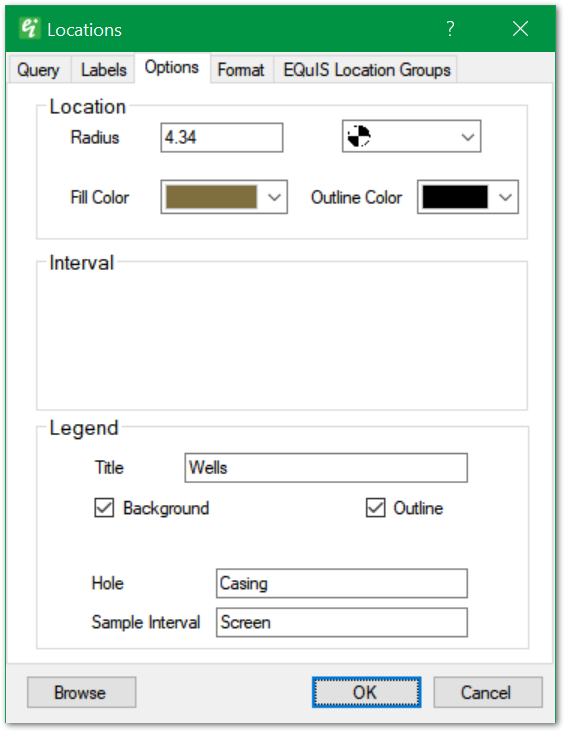
Location Radius – Set location symbol radius in real-world length units.
Location Symbol – Use drop-down in the top right to select the location symbol style.
Location Fill Color and Outline Color – Select the location symbol fill and outline colors.
Interval – This section is populated for location plots on cross-sections or in 3D.
Legend Title – Enter legend title.
Legend Background – Check to draw legend background.
Legend Outline – Check to draw legend outline.
Legend Hole and Sample Interval – Set descriptive terms used in legend (only used in 2D and 3D location plots).
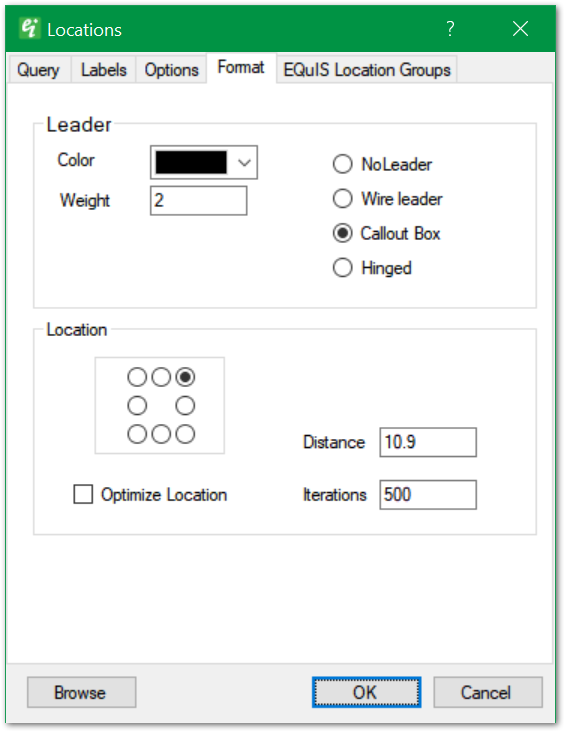
Leader Color – Select the leader line color.
Leader Weight – Enter the leader line weight.
Leader Style – In the right side of the Leader section, select the leader style (Wire leader, Callout Box, or Hinged) or indicate that no leader is desired.
Location Label Position – Select one of the radio buttons in the grid of the Location section to specify label positions relative to the location.
Location Optimize Location – Check to optimize label positions to minimize overlap. This option cannot be used in conjunction with the above label position option.
Location Distance – Set default distance of labels from location.
Location Iterations – Set number of iterations for optimization process. More optimization will improve results.
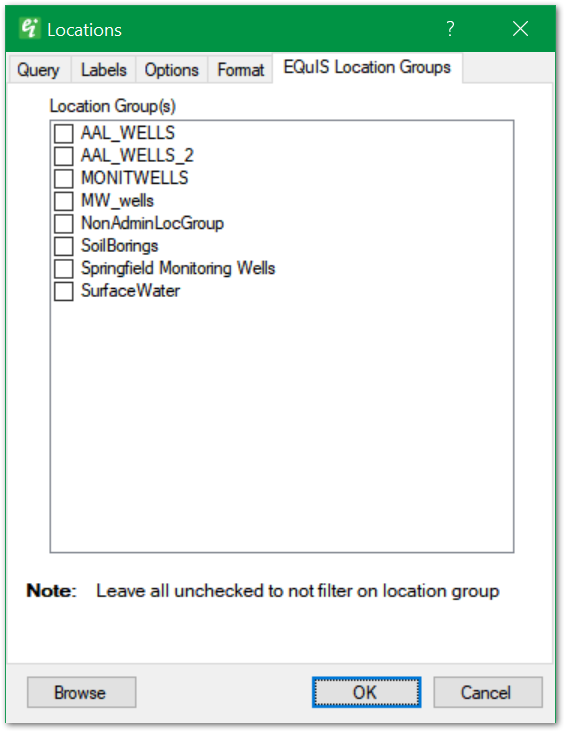
Location Group(s – Check to filter on EQuIS location group(s).