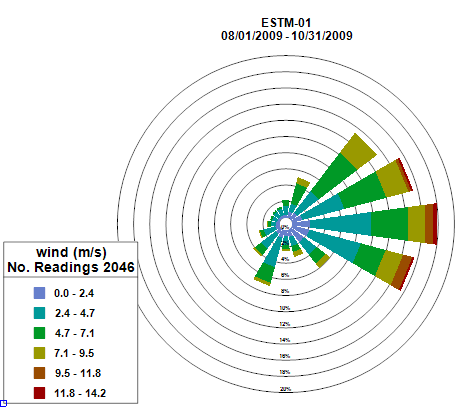
EnviroInsite allows for the generation of high-quality, wind rose diagrams to document wind speed intensity and direction at a location. Wind rose diagrams are presented in a circular format using a polar coordinate system of gridding with north at the top. The frequency of winds over a time period is plotted by wind direction. Colors bands indicate categories of wind speed, emanating from zero at the center to increasing wind speed at the outer circles.
The data structure is not typical of measured data, so rather than adding a new table, it appropriates the detection limit field in the Observations table for the storage of the wind direction in degrees clockwise.
For EQuIS users, the wind speed and direction are stored in two records within DT_LOCATION_PARAMETER.
To create a wind rose plot, select Window> New> Charts from a plan view map. A new view window is generated. Select Plot> Wind Rose to open the Wind Rose dialog box. Modify the properties on the Options tab and Speed Intervals tab as desired. Click the OK button to save changes.
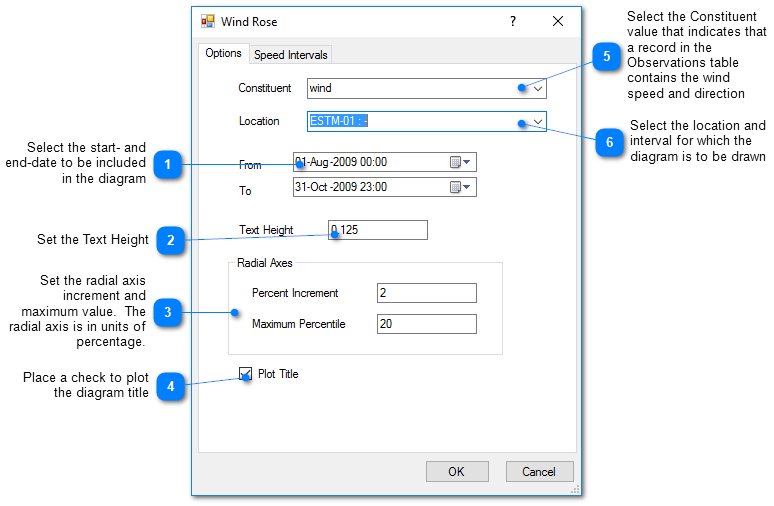
Options Tab
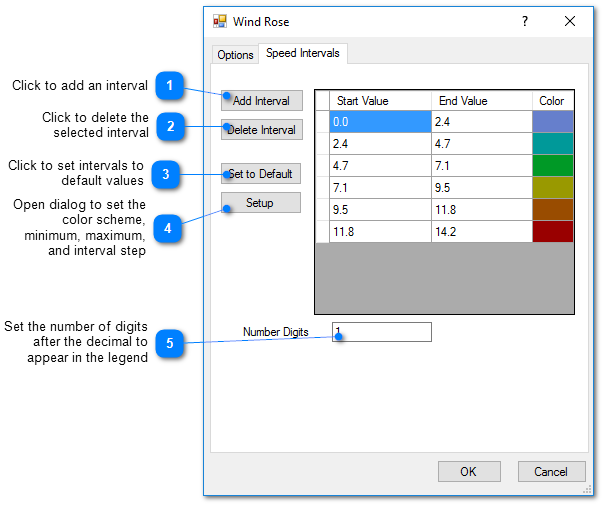
Speed Intervals Tab