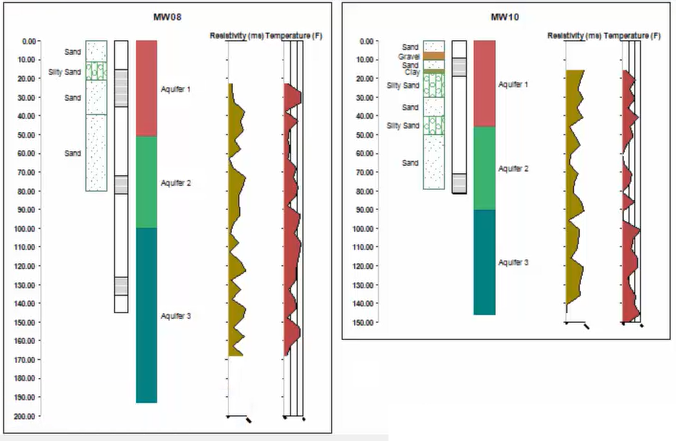
Strip logs provide an incredibly flexible means of displaying soil, stratigraphy, well construction, individual observations, and charts of geophysical data on a single plot. These plots may be tiled to view and analyze many strip logs in a single view window. Employ strip logs to understand the complex site stratigraphy that impacts on the fate and transport of environmental contaminants.
View a training video on the creation of strip logs here.
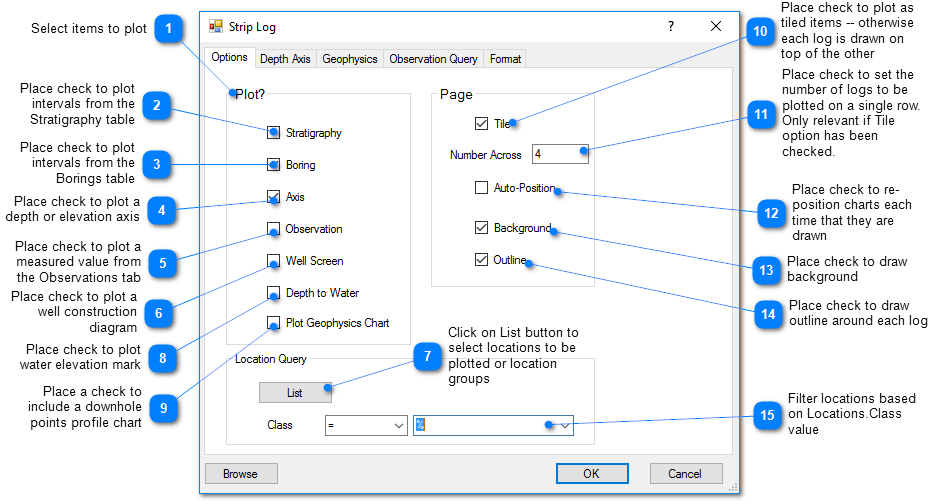
Open the Tasks Pane on the right-hand side of the EnviroInsite interface, select Create Window and then select Strip Logs. A new view window is generated and the Strip Log dialog box opens. Modify the plot properties on the Query tab, Depth Axis tab, Geophysics tab, Observation Query tab, and Format tab as desired. Click the OK button to save changes.
Options Tab
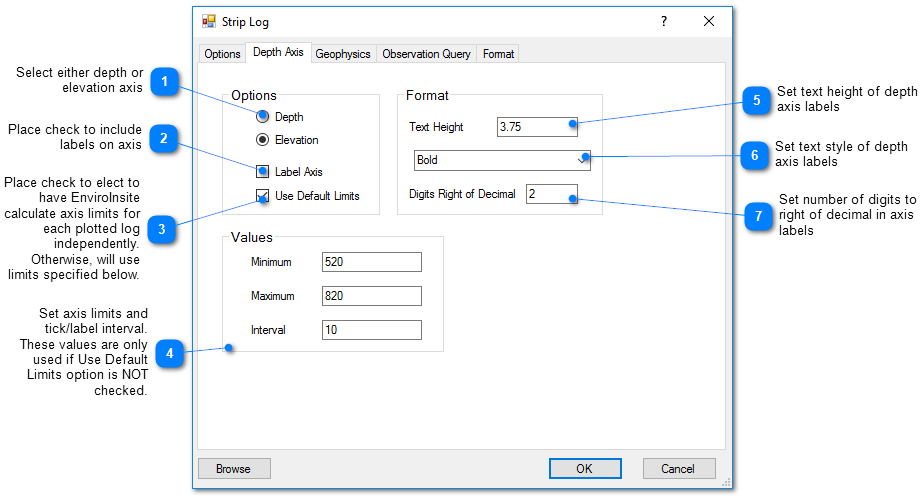
Depth Axis Tab
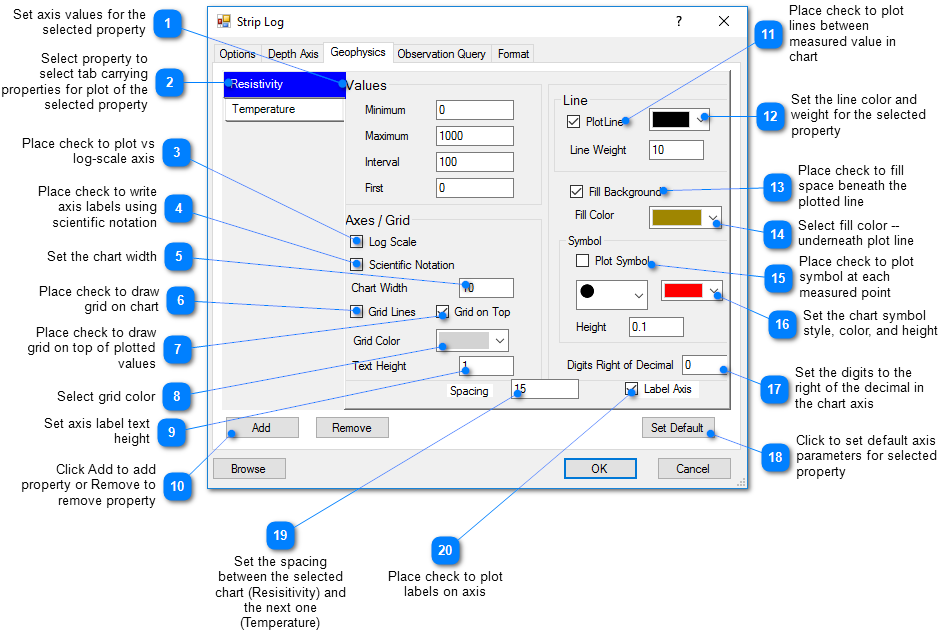
Geophysics Tab
Click the Add button to add a new parameter to be in a geophysics plot. Select the desired parameter(s) from left list box and use the => button to transfer the parameter(s) to the selected box. The parameters must be stored in the Point Values table and listed in the Constituents table with "Point Values" in the Media field.
Observations Query Tab
Select the constituent, fraction, and sample media whose value is posted on the strip log plot. Also, select what value is to be plotted (i.e., mean, maximum, minimum, first, or last) and the date range for the measured values.
Format Tab
Hatch Scale Multiplier: All of the hatched boring or stratigraphy intervals are multiplied by this hatch scale. This scale supersedes the individual hatch scales specified in the Soil Style and Stratigraphy Style dialogs.