XY Charts can generate a chart of stacked lines that are separated vertically against the results of a report (e.g., Analytical Results II report) with a date type column (e.g., SAMPLE_DATE of ARII report) being as the X-axis. It plots the lines of each series determined by the Group Series By parameter in one chart, with the lines separated vertically. The following example using the Springfield facility illustrates how to generate a chart of stacked lines that are separated vertically.
1.Run the ARII report with Acetone, Antimony, and Benzene (or other analytes) at the B-30 and B-31 locations and start XY Chart.
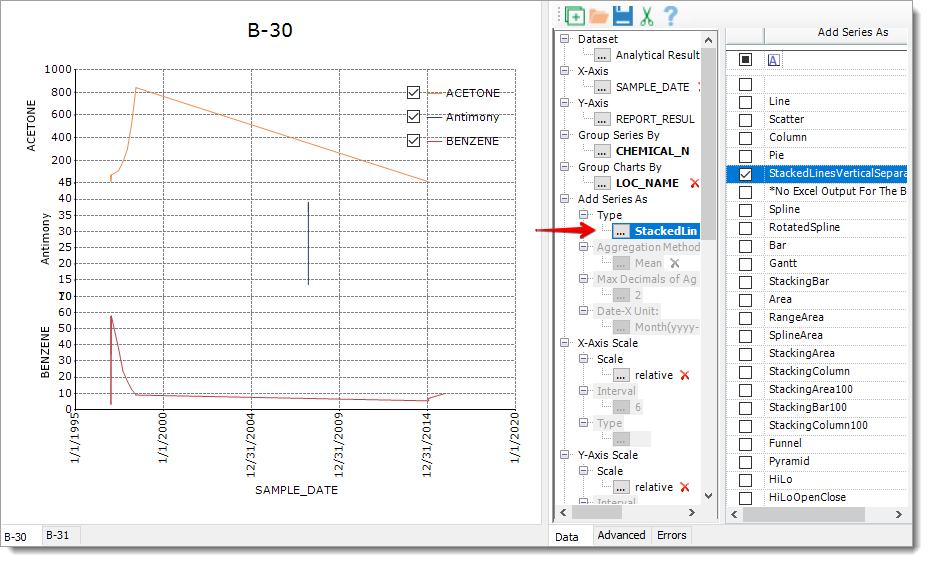
2.Select Group Series By = CHEMICAL_NAME, Group Charts By = LOC_NAME, Add Series As = StackedLinesVerticalSeparation, and then click Add Series to create charts.
Note: Charts can be exported to Excel. When a prompt is shown to enter a file name during the export, select "Save as type" as .xls so the legends of the chart will display correctly. The stacked lines are drawn in a specially customized method in Excel (see image below). |

Figure 2