Add Action Levels to XY Charts by following the steps below.
1.In EQuIS Professional, click Reports in the Open section of the Home ribbon.
2.Select the Analytical Results Report and then click Open.
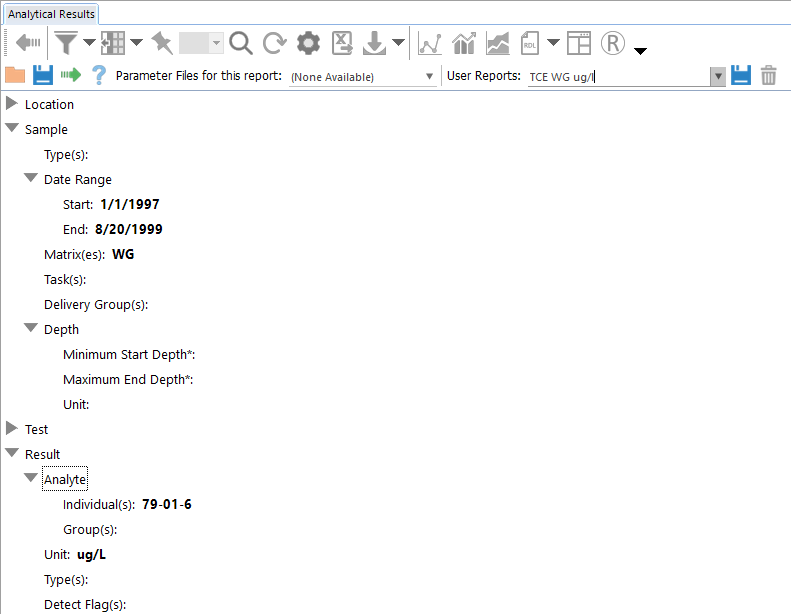
3.Click and select the following:
Parameters |
Selection |
|---|---|
Sample Date Range End |
08/20/1999 |
Sample Matrix(es) |
WG |
Result Analyte Individual(s) |
Tricholoroethylene |
Result Units |
ug/l |
4.Type TCE WG ug/l in the blank User Reports field to save the query parameters, and click Save.
5.Click Go ![]() to run the report. The results will be returned in grid format.
to run the report. The results will be returned in grid format.
6.Click Reports in the Open section of the Home ribbon.
7.Select the Action Level Exceedance Report and then click Open.
8.Click and select the following:
Parameters |
Selection |
|---|---|
Saved Report |
TCE WG ug/l |
Action Level(s) |
CLEANWATER INDUST |
Exceedance Flag |
xxx |
9.Click Go ![]() to run the report.
to run the report.
10.Click XY Chart on the Action Level Exceedance menu.
11.In the Data pane, select the following:
Parameters |
Selection |
|---|---|
Dataset |
Action Level Exceedance |
X-Axis |
SAMPLE_DATE |
Y-Axis |
REPORT_RESULT_VALUE |
Group Series By |
CHEMICAL_NAME |
Group Charts By |
SYS_LOC_CODE |
Note: Setting the parameter Group Charts = SYS_LOC_CODE sorts the results by putting multiple tabs at the bottom of the Trend Plot. Select each tab to view the Analytical Results XY Chart for that chemical. |
12.Click Add Series in the Data pane to display the trend plot.
13.Select B-75.
14.In the Data pane, select the following:
Parameters |
Selection |
|---|---|
dataset |
Action Level Exceedance |
X-Axis |
SAMPLE_DATE |
Y-Axis |
ACTION_LEVEL |
Group Series By |
ACTION_LEVEL_CODE |
Group Charts By |
SYS_LOC_CODE |
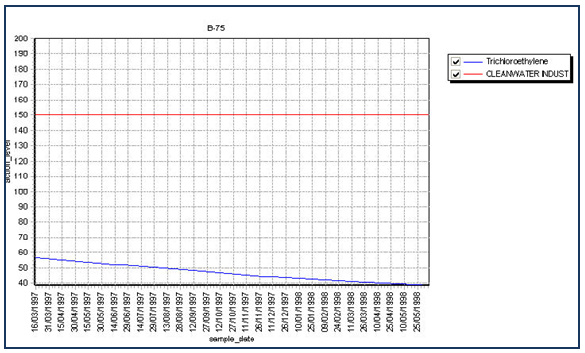
15.Click Add Series in the Data pane to display the trend plot. The analytical results are present, but the left axes needs to be adjusted to make the Action Level visible.
16.Right-click in the white space of the chart and select Advanced > Active Chart.
17.Click the Advanced tab to the right of the Data pane.
a.Expand the Axes node.
b.Expand the Left node.
c.Change the following parameters:
Parameters |
Selection |
|---|---|
AutomaticMax |
False |
Maximum |
200 |
After the options from the Advanced tab have been set, the chart should appear as in the figure below.
Troubleshooting
Tip: If Action Levels have not been established for all of the chemicals included in the query, one or more errors may appear. One such error:
indicates that null values cannot be plotted on an XY Chart. Ignore the error. To avoid this error, filter the date by doing the following:v •Return to the Action Level Exceedance Tab and click Filter. •Click the Filter button and select Non Blanks In the ACTION_LEVEL_CODE column. •Run the report again. |