Active Reports is a third party application that has been built into the EQuIS Professional application to allow users to design their own reports.
In this exercise, users will create a report that will join multiple tables and views to generate a report used by many EQuIS users. The report generated will have Headers and Footers.
Step 1: Review Report
Review the report and determine where in the database the information used in the report will come from.
Tip: The Active Reports tool can use more than data tables to create a "pretty report". Be sure to consider EQuIS standard reports, views, and functions when assessing where the data that will populate the report will come from. |
The water level information (Well ID, Date of Gauging, Northing, Easting, and depth to groundwater fields) are included in the "Water Levels (Most Recent)".
The well construction information can be taken from VW_WELL.
Step 2: Populate Data Source
Populate Data Source in Active Reports to make VW_WELL and the Water Levels (Most Recent) Report available.
•In EQuIS Professional, click the Forms button (in Open group on Home EQuIS Ribbon).
•Select and open the Active Reports Form.
Note: This report uses data from two locations in the database. Therefore, create a JOIN in the SQL Data Source for Active Reports. |
Tip: All of the code for standard EQuIS database reports is available using the Data Source Menu in Active Reports. Populating Data Source in Active Reports using this method will also allow users to utilize the screen prompts built in with these reports. This tip will be applied in the exercise. |
•Select the Data Source Menu drop-down.
•Click the node to the left of Database Reports to expand the list of available database reports.
•Double-click on the Water Levels (Most Recent).
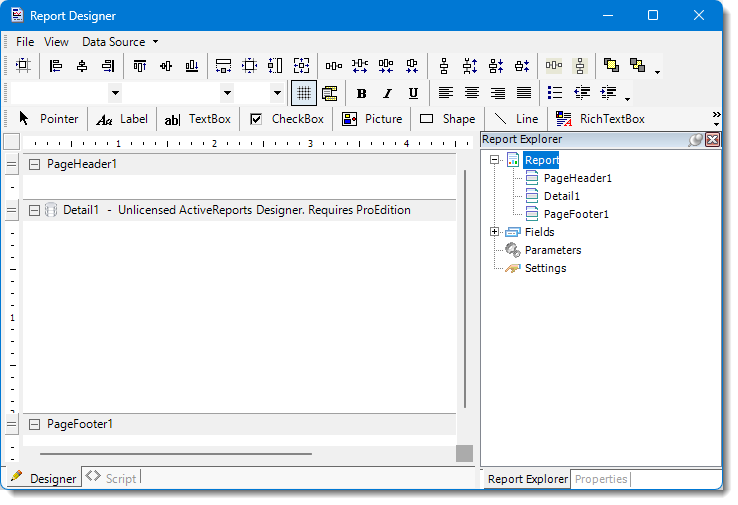
•In the Report Explorer portion of Active Reports (right-hand side of the Report Designer), expand the Fields and Bounds node. The list will represent all of the fields that are available in the Water Levels (Most Recent) Report.
• In the Detail pane, click the cylinder-shaped database button to the left of the word "Detail". This will open the Report Data Source window. To add the VW_WELL fields to the Bounds list, add the following SQL to the end of the Data Source for the report.
as wl inner join vw_well as w on wl.facility_id = w.facility_id and wl.sys_loc_code = w.sys_loc_code inner join dt_facility as f on w.facility_id = f.facility_id |
•The current version of Active Reports will not update the Bounds list (i.e., it does not update to reflect the additions made to the Data Source). To work around this issue:
oLaunch Active Reports.
oOpen the rpx file that was previously created (File > Load Report > From File).
oOpen the Data Source and copy the code for the report.
oClose Active Reports.
oLaunch Active Reports.
oOpen the Data Source and paste in the code Report Data Source Window.
oExpand the Bounds; the data source will be added.
oOpen the rpx file previously created; all of the fields for the Data Source will still be listed in the Bounds.
•Once this is done, finish the design of the report.
Step 3: Add Fields
Add fields to the body of the report.
•Click and drag the fields to be included in the report into the Detail1 section of Active Reports in the order they will appear in the report.
oAt this time, add only the fields available in the Water Levels (Most Recent) Report.
•Click File > Preview to preview the report at this point. Note the screen prompts that appear. These are from the Water Level (Most Recent) Report code selected from the Data Source menu.
Tip: In the screen prompt, select two or three locations to return data faster during the report building process. |
Step 4: Add Column Headers
Add column headers to the body of the report.
•Close the preview screen from Step 2.
•Right click on ReportHeader1.
•Select Insert > Page Header.
oThe Page Header will be repeated at the top of each page of the report.
•From the Active Reports Toolbar, select TextBox.
•The cursor will appear as a crosshair. With this tool, draw a box above the SYS_LOC_CODE field added in Step 2.
•Double click on the box.
•In the Properties tab on the right-hand side of the screen:
oIn the Data section, enter “Well ID” in the Text field.
oIn the Appearance Section, expand Font, and set Bold to True.
oSet the alignments to “Center”.
•Repeat this step for each of the column headers in the desired report.
Tip: Copy the formatting and rename the Text Boxes by right-clicking on and selecting Copy and Paste. |
Step 5: Add Report Header
Do the following to add a Report Header:
•Select TextBox from the Active Reports Toolbar.
•The cursor will appear as a crosshair. Use this tool to draw a box where the headers should be.
•Double-click on the box.
•Enter header information for the report in the Properties section.
Step 6: Refine Formatting
Refine the Formatting of the Report by doing the following:
•Date Format:
oDouble-click on the MEASUREMENT_DATE field.
oClick on the ellipse OutputFormat in the Appearance section of the Properties tab.
oChange the format to Custom "dd/mm/yyyy".
•Numbers:
oDouble-click on the X_COORD or Y_COORD field.
oClick on the ellipse OutputFormat in the Appearance section of the Properties tab.
oChange the format to Number.
oMake the desired modifications.
•The cursor will appear as a crosshair. With this tool, draw a box for the header.
•Double-click on the box.
•In the Properties section, enter header information for the report.