Report Name: Species Density: Species Per Subfacility (example)
File Name: EarthSoft.Reports.Library.77495.dll
Dependencies: Licensed Alive Module and Alive Schema
Software: EQuIS Professional, EQuIS Alive, EQuIS Enterprise
Source: EQuIS Professional install (Alive Module)
Language: English
Output Type: Report Grid1
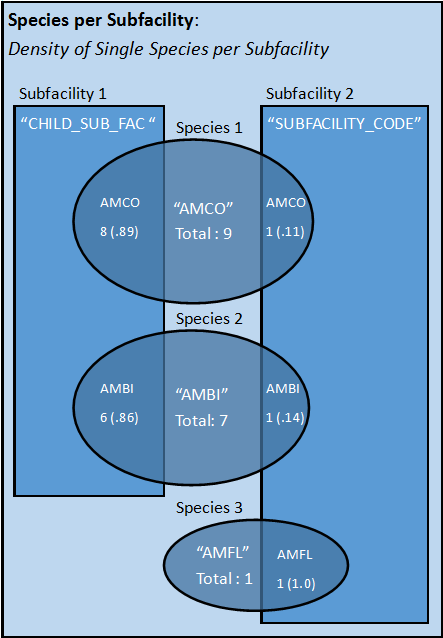
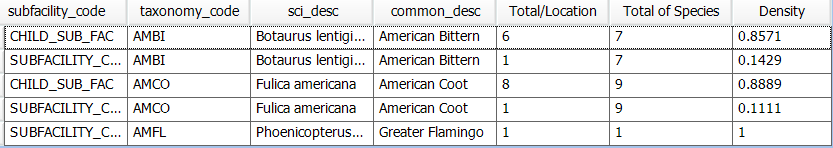
Description: This report output includes the "Total per Subfacility" for the quantity of each species per subfacility, and the Total of Species (quantity) for all subfacilities. It generates the Density for individual species by dividing the "Total per Subfacility" by the "Total of Species".
Installation Instructions: This report requires a licensed EQuIS Alive Module and the Alive Schema applied to the database. The report is included in the EQuIS Professional install when the Alive Module feature has been enabled during installation. For more information see Alive Installation.
Overview:
This report is accessible via Enterprise provided that any parameter selection(s) are made in Professional, and saved as a User Report.
The following diagram should help visualize the data returned by this report. The values of the diagram correspond to the example data shown beneath the diagram.
Tables: DT_SUBFACILITY, RT_TAXONOMY, DT_SURVEY, DT_SURVEY_OBSERV
Report Parameters |
||||||||||||||||||||||||||||
|---|---|---|---|---|---|---|---|---|---|---|---|---|---|---|---|---|---|---|---|---|---|---|---|---|---|---|---|---|
|
1The Report Grid provides additional export options to Excel, Google Earth, Outlook, Shapefile, PDF, Text, Access, XML, or a printer.