|
<< Click to Display Table of Contents >> Navigation: EQuIS Library > Reports > Standard Reports > Statistics > Relative Percent Difference II |
Report Name: Relative Percent Difference II (example)
File Name: EarthSoft.Reports.Library.60983.dll
Dependencies: N/A
Software: EQuIS Professional and EQuIS Enterprise
Source: EQuIS Professional install
Language: English
Output Type: Excel1
Description: The Relative Percent Difference (RPD) II report determines the difference between analytical results reported in primary, duplicate, and triplicate samples.
Installation Instructions: This report assembly is part of the EQuIS Professional installation. No additional installation steps are necessary.
Overview:
The Relative Percent Difference II report includes the following functionality:
1.A user interface for input parameters that is user friendly and easily understandable.
2.The required input parameters are labeled as Required.
3.The Report Result Units and Sample Matrix input parameters are no longer a required selection to generate a report.
4.Sample Matrix is modified from single selection to multiple selection.
5.Analyte group(s) is added onto the user interface.
6.Sample types can be selected for original, duplicate, and triplicate types over the user interface.
Notes:
•If the units of measurement for the primary, duplicate, and triplicate samples are different, users need to select Unit(s) or Analyte\Analyte Group(s) to unify units (and ensure the necessary unit conversion factor(s) is present).
•The Relative Percent Difference Report involves multiple calculations, so the processing time may take longer than expected. To avoid problems with delay, users may narrow the data input and/or extend the database connection timeout.
•The Detection limit is a key to this report and the calculations are not valid when results without a detection limit are used in the report. With that in mind, we suggest not using this report until the appropriate detection limit is populated for each of your results.
This report includes error diagnosis for no output situations. Error diagnosis can help determine the potential cause for no output, such as: no primary sample data, no duplicate sample data, no triplicate sample data or no matching up of chemical name fractions.
Relative Percent Difference Calculation Equation
|(x2 - x1)|/((x2 + x1)/2)
In Professional Version 6.3 or earlier, |(x2 - x1)|/((|x2| + |x1|)/2)
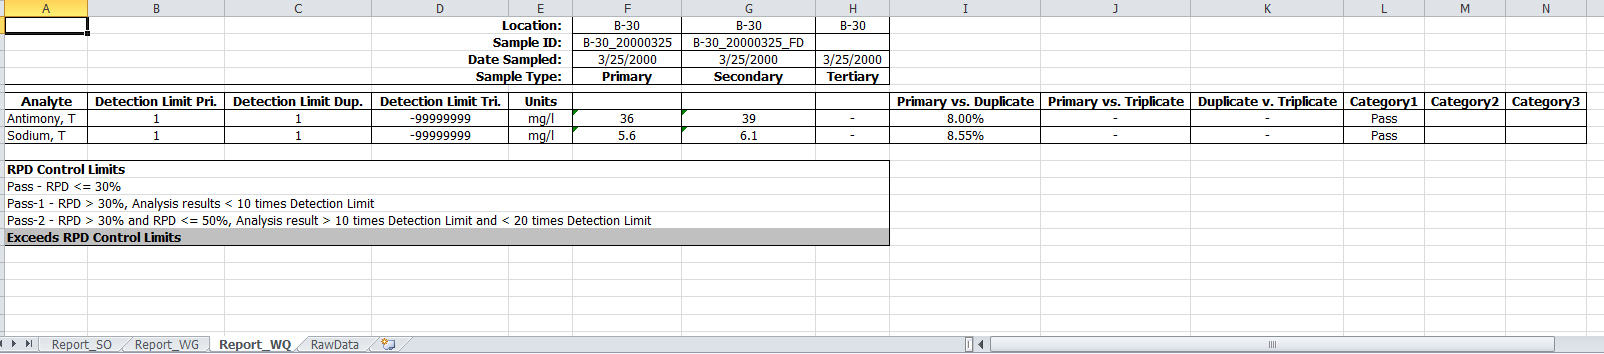
The Report Tab compares the analytical results against the laboratory Practical Quantitation Limit (PQL) of the analyte(s) and any result differences encountered in the primary, secondary, and tertiary sampling. The RPD is calculated as the absolute value of the difference between original and replicate samples divided by the average, and then expressed as a percentage.
The report checks RPD and the sample results used to calculate RPD and determines and determines if the analyte falls into a defined RPD control limit category. The RPD control limits can be defined by the report parameter selections. The following describes how the results of Category 1-3 are determined.
Assume:
RL = "Detection Limit:\Reporting Limit"
DL_LL_multiplier = "Detection Limit:\Lower Limit: (Required)" (defaults to 10)
DL_UL_multiplier = "Detection Limit:\Upper Limit: (Required)" (defaults to 20)
RPD_LL = "Relative Percent Difference:\RPD Lower Limit: (Required)" (defaults to 30%).
RPD_UL = "Relative Percent Difference:\RPD Upper Limit: (Required)" (defaults to 50%)
Determine the result of Category 1 (primary vs duplicates, sample results), Category 2 (primary vs triplicates) or Category 3 (duplicates vs triplicates) of an analyte based on:
Pass: Pass is identified if RPD ≤ RPD_LL.
Pass 1: Pass 1 is identified If
A. Pass is not identified, and
B. Each of the 2 sample results < (use ≤ if UseEqualToInUpperLimit=True) DL_LL_multiplier * RL.
Pass 2: Pass 2 is identified if
A. Pass 1 is not identified, and
B. RPD < (use ≤ if UseEqualToInUpperLimit=True) RPD_UL, and
C. Each of the 2 sample results ≥ ( use > if UseEqualToInUpperLimit=True) DL_LL_multiplier * RL, and
D. Each of the 2 sample results < (use ≤ if UseEqualToInUpperLimit=True) DL_UL_multiplier * RL.
Fail: Fail Is identified If Pass, Pass 1 and Pass 2 are not identified.
Warning: Older databases may contain double "Reportable Result(s)" in the published report. The @reportable parameter was replaced by @reportable_results over time. If both parameters exist in ST_REPORT_PARAMETER, the conflict will prevent the "Reportable Result(s)" parameter from working.
Resolution: The fix depends on the contents of ST_USER_REPORT_PARAMETER for user reports of this report. First, filter ST_USER_REPORT_PARAMETER with the REPORT_ID for the RPD II report, found in ST_REPORT. •Case 1 – Only @reportable (old parameter) exists: •Case 2 – Both @reportable (old parameter) and @reportable_results (new parameter) exist: a.Delete @reportable records for these user reports in ST_USER_REPORT_PARAMETER. b.Have users double-check the "Reportable Result(s)" parameter in their user reports. •Case 3: Only @reportable_results (new parameter) exists:
After resolving the duplicate parameters in ST_USER_REPORT_PARAMETER, delete the @reportable record for this report in ST_REPORT_PARAMETER. |
Report Requirements for DT_SAMPLE.SAMPLE_TYPE_CODE |
|||||||||||||||
|---|---|---|---|---|---|---|---|---|---|---|---|---|---|---|---|
|
Tables: DT_FACILITY, DT_LOCATION, DT_RESULT, DT_SAMPLE, DT_TASK, RT_ANALYTE, RT_GROUP, RT_MATRIX, RT_MTH_ANL_GROUP, RT_SAMPLE_TYPE
Report Parameters |
||||||||||||||||||||||||||||||||||||||||||||||||||||||
|---|---|---|---|---|---|---|---|---|---|---|---|---|---|---|---|---|---|---|---|---|---|---|---|---|---|---|---|---|---|---|---|---|---|---|---|---|---|---|---|---|---|---|---|---|---|---|---|---|---|---|---|---|---|---|
|
1Excel report output requires a valid license of Microsoft Excel to view the output.
Copyright © 2026 EarthSoft, Inc. • Modified: 06 Dec 2022