|
<< Click to Display Table of Contents >> Navigation: EQuIS Library > Reports > Standard Reports > Graphs > MultiParameter Time Series Chart |
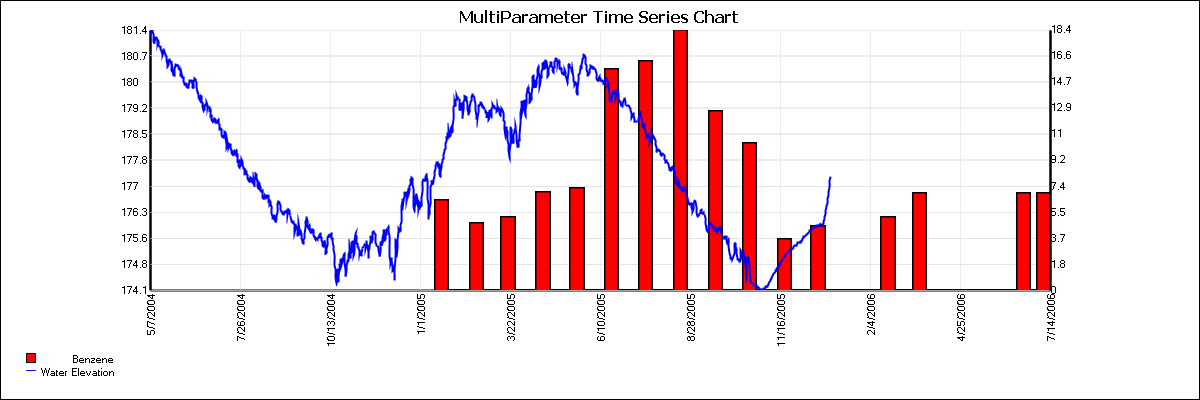
Report Name: MultiParameter Time Series Chart (example)
File Name: EarthSoft.Reports.Library.24130.dll
Report Dependencies: N/A
Software: EQuIS Professional and EQuIS Enterprise
Source: EQuIS Professional install
Language: English
Output Type: Excel1
Description:This report lets both Professional and Enterprise users create time series charts using a variety of parameters.
Installation Instructions: This report assembly is part of the EQuIS Professional installation. No additional installation steps are necessary.
Overview:
First, select a location and date range (and optionally header and footer text for the chart).
Next, add up to nine different series to the chart.
For each series, select the following:
•Parameter: (may be from analytical results, location parameters or water levels)
•Axis: either Left or Right
•Type: either Line or Bar
•Color: either Black, Blue, Green, Red or Yellow
Tables: DT_LOCATION, DT_LOCATION_PARAMETER, DT_RESULT, DT_SAMPLE, DT_SAMPLE_PARAMETER, RT_ANALYTE, RT_LOCATION_PARAM_TYPE, RT_SAMPLE_PARAM_TYPE
Report Parameters |
||||||||||||||||||||||||||||||||||||
|---|---|---|---|---|---|---|---|---|---|---|---|---|---|---|---|---|---|---|---|---|---|---|---|---|---|---|---|---|---|---|---|---|---|---|---|---|
|
Report Output |
|---|
The output for this report contains graphs as *.png files or within an Excel workbook. |
1Excel report output requires a valid license of Microsoft Excel to view the output.
Copyright © 2026 EarthSoft, Inc. • Modified: 26 May 2025