|
<< Click to Display Table of Contents >> Navigation: EQuIS Library > Reports > Standard Reports by Product > Standard with Alive > Alive – Google Earth Species Observation Points (XYZ Plot) Report |
Report Name: Google Earth: Species Observation Points (XYZ Plot) (example)
File Name: EarthSoft.Reports.Library.77764.dll
Dependencies: Licensed Alive Module and Alive Schema
Software: EQuIS Professional, EQuIS Alive, EQuIS Enterprise
Source: EQuIS Professional install (Alive Module)
Language: English
Output Type: Keyhole Markup Language (*.kmz)1, 2, 3
Description: This Google Earth Report exports EQuIS Alive survey observation points to a *.kmz, and separates each by observation time. The taxonomy, observation time, and quantity are included to display for each point.
Installation Instructions: This report requires a licensed EQuIS Alive Module and the Alive Schema applied to the database. The report is included in the EQuIS Professional install when the Alive Module feature has been enabled during installation. For more information see Alive Installation.
Overview:
This report is accessible via Enterprise provided that any parameter selection(s) are made in Professional, and saved as a User Report. This report requires Observation coordinates populated and in lat long (DT_SPATIAL_EXTENT.COORD_TYPE_CODE=LAT LONG where .SPATIAL_EXTENT_ID = DT_SURVEY_OBSERV.SPATIAL_EXTENT_ID)
Tables: DT_SUBFACILITY, RT_TAXONOMY, DT_SURVEY, DT_SURVEY_OBSERV
Report Parameters |
||||||||||||||||||||||||||||||||||
|---|---|---|---|---|---|---|---|---|---|---|---|---|---|---|---|---|---|---|---|---|---|---|---|---|---|---|---|---|---|---|---|---|---|---|
|
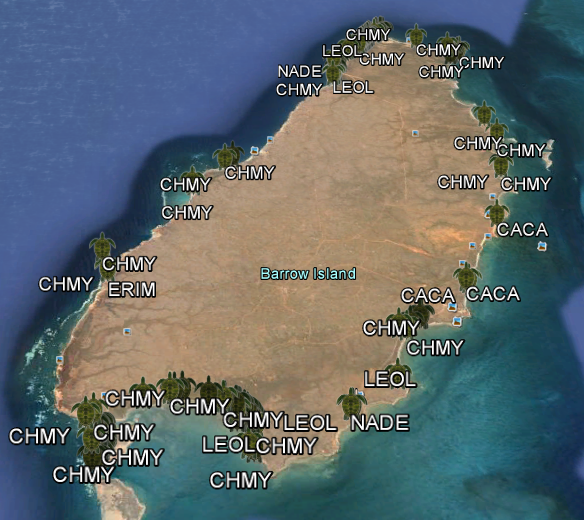
Report Output |
|---|
The output for this report is visualized in a *.kmz that can be viewed in Google Earth. |
1Using Google Earth for commercial purposes requires a commercial license from Google which must be obtained separately by the end user.
2EQuIS Google Earth reports do not require Google Earth or Google Services to generate KML files. Charts may be generated by Google Charts.
3KML is an open standard that may be read or viewed in other applications. These reports have only been tested in Google Earth.
Copyright © 2026 EarthSoft, Inc. • Modified: 17 Feb 2026