Profile charts are ideal for downhole plotting of geophysical data. For EQuIS users, the data for downhole profile plots is drawn from DT_DOWNHOLE_DATA. For non-EQuIS users, only constituents with a Media field value of "Point Values" in the Constituents table may be plotted using a downhole profile plot.
Click Plot> 3D Data from the main menu and select Downhole Profile. Modify the properties on the Query tab, Format tab, and Axis tab as desired. Click the OK button to save changes.
Query Tab
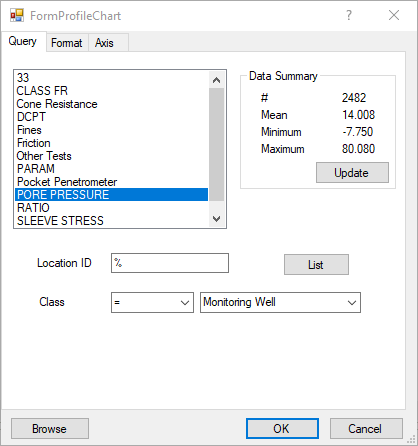
Constituent List – Select one constituent whose values will be plotted.
Location ID – Enter location to be plotted or "%" for all locations.
Class – Select Class field value for filtering of well selection.
List – Click the List button to select from a location group or to select multiple individual locations.
Browse – Click the Browse button to view selected data in a grid.
Format Tab
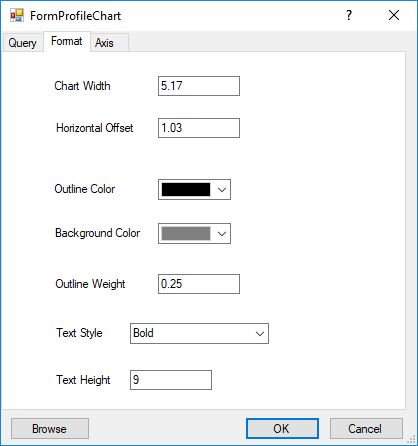
Chart Width – Enter Chart width in world coordinates.
Horizontal Offset – Enter horizontal offset distance of chart origin from measurement location.
Outline Color – Select chart area outline color.
Background Color – Select fill color by hitting color button.
Outline Weight – Enter outline weight in tenths of millimeters.
Text Style – Select text style.
Text Height – Enter text height in world coordinates.
Axis Tab
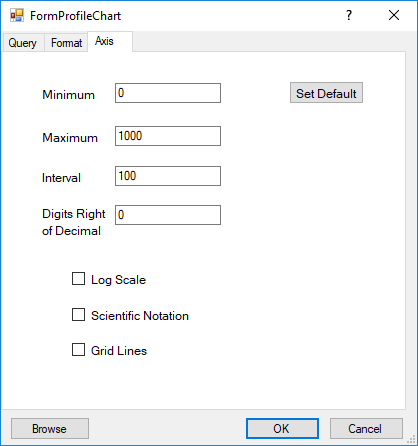
Minimum – Enter the axis minimum.
Maximum – Enter the axis maximum.
Interval – Enter the axis tick interval.
Digits Right of Decimal – Enter the number of digits right of the decimal to be included in the axis labels.
Log Scale – Check to plot values using log transform of numeric values.
Scientific Notation – Check to plot values in axis using scientific notation.
Grid Lines – Check to plot grid lines.