•Setting the X and Y Axis to Absolute
•Set the Maximum and Minimum values for X and Y Axis
Setting the X and Y Axis to Absolute
1.Run ARII with some parameters selected and open XY Charts. Click Add Series to generate a chart with default parameters whose X-Axis Scale>Scale (or Y-Axis Scale>Scale) defaults to relative.
2.Click Clear Series, set X-Axis Scale>Scale and/or Y-Axis Scale>Scale as absolute. Click Add Series to generate the chart.
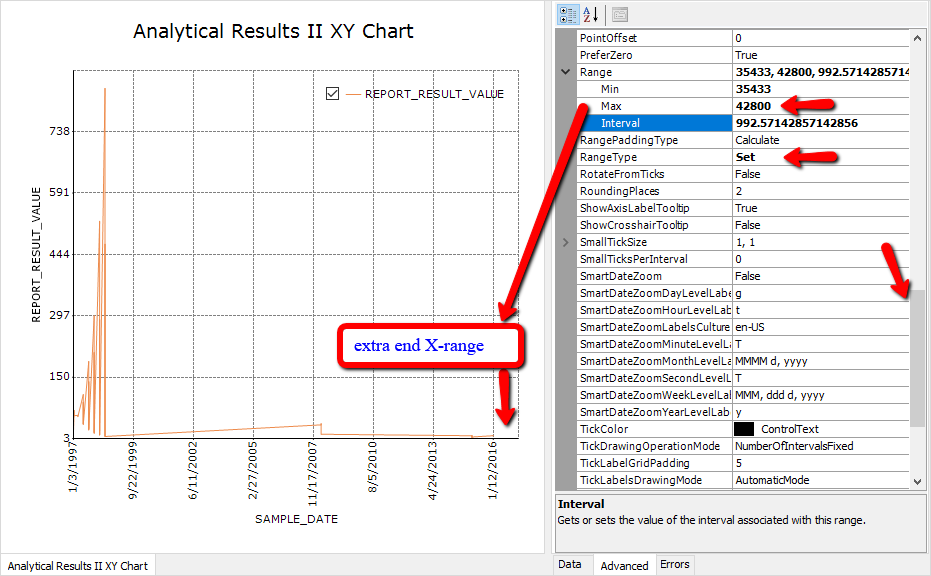
Notes: •The X (or Y)-Axis range is automatically calculated based on the charting data with the default chart parameter Scale setting of "relative". The RangeType for the axis must be changed to Set in the Advanced tab, as shown in Figure 1 and described in the final section, for the axis settings to be preserved when exporting the chart to Excel. •The max and min of the X (or Y)-Axis r ange are calculated based on and applied to all charts, if multiple charts are created (to be used where multiple charts need to be reviewed under the same X and/or Y scales). |
Set the Maximum and Minimum Values for X and Y Axis
Set a specific maximum or minimum axis value in the Advanced tab in the XY Chart by following the steps below:
1.Click on the Advanced tab.
2.Click anywhere below the X-axis.
3.Scroll down through the properties of Advanced tab, to the Axes section, to find and expand Range to adjust Min/Max/Interval. For example, Max is changed from 42381 to 42800 and an extra ending X-range is added in the chart (see Figure 1).
Note: The RangeType is Set when X-Axis Scale>Scale (or Y-Axis Scale>Scale) is selected as absolute. Changing RangeType from Set to Auto will switch the chart back to a range similar to the default relative range. |

Figure 1