Follow the steps below to display data point labels.
1.Create the Line Chart.
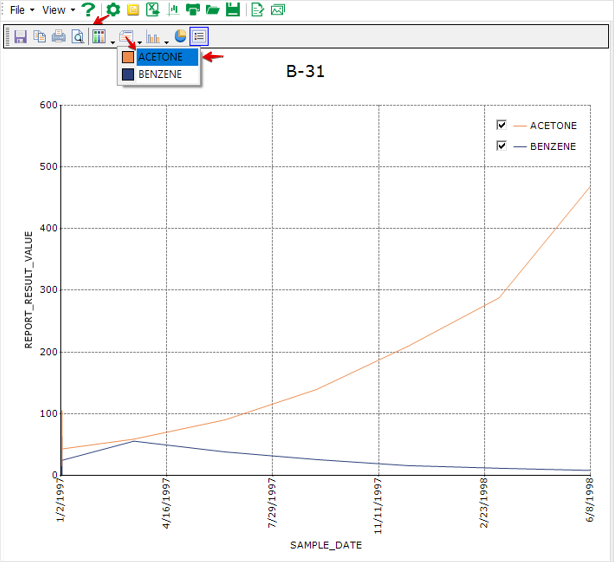
2.Click Turn On/Off Current Chart Editor ![]() from the Chart toolbar.
from the Chart toolbar.
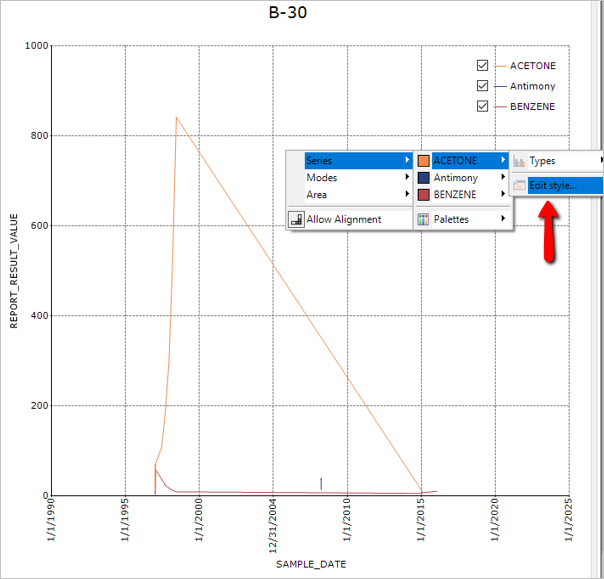
3.Click the Edit Style ![]() tool on the Chart Editor toolbar and select a chart series to be edited.
tool on the Chart Editor toolbar and select a chart series to be edited.
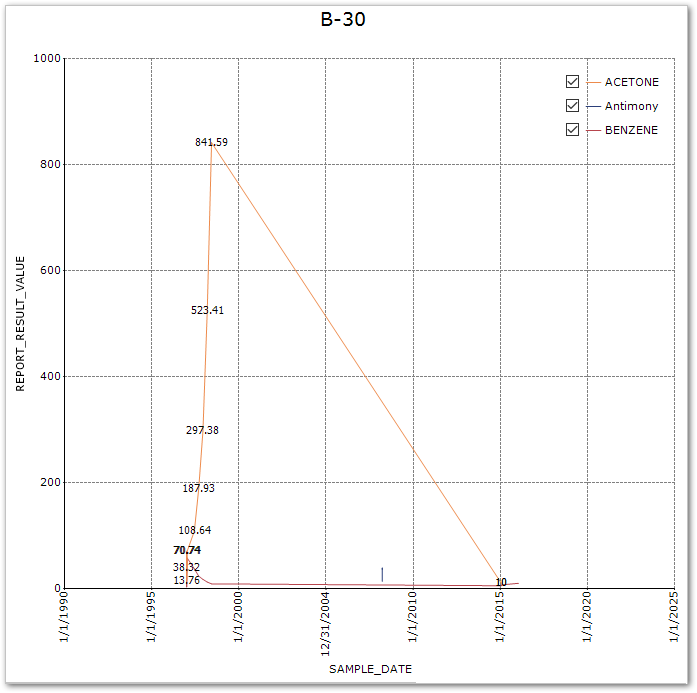
4.Select Text in the Chart Series Style window. Check Display Text and click OK. The Y-axis values are displayed as the labels at the data points (see two images at end of this article).
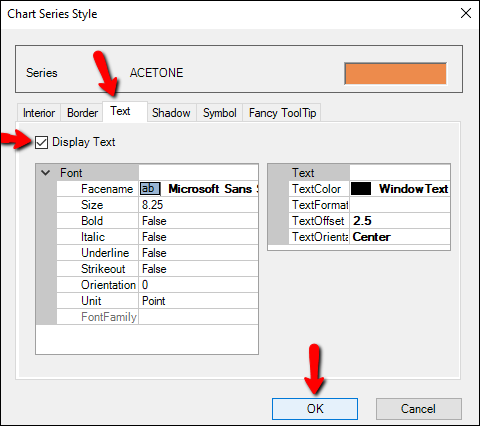
Notes: •To adjust the font and positions etc. of the labels, modify the properties under Font and Text (see image above). •The highlighted label (70.74) indicates a duplicated value (see image below). •Adding chart labels is conducted to one chart series of the active chart at a time. •Data point labels are not supported in Excel exports, but are included in image file exports. |