|
<< Click to Display Table of Contents >> Navigation: EQuIS Library > Reports > Standard Reports by Product > Standard with EnviroInsite > EnviroInsite Analyte Concentration Map |
Report Name: EnviroInsite Analyte Concentration Map (example)
File Name: EarthSoft.Reports.Library.EnviroInsite.dll
Dependencies: Licensed EnviroInsite Module
Software: EnviroInsite
Source: EnviroInsite install
Language: English
Output Type: *.pdf, *.svg, *.dxf, *.dwg, *.shp, *.emf, *.wmf, *.png, *.jpg, *.tif, *.vds, or *.vdml
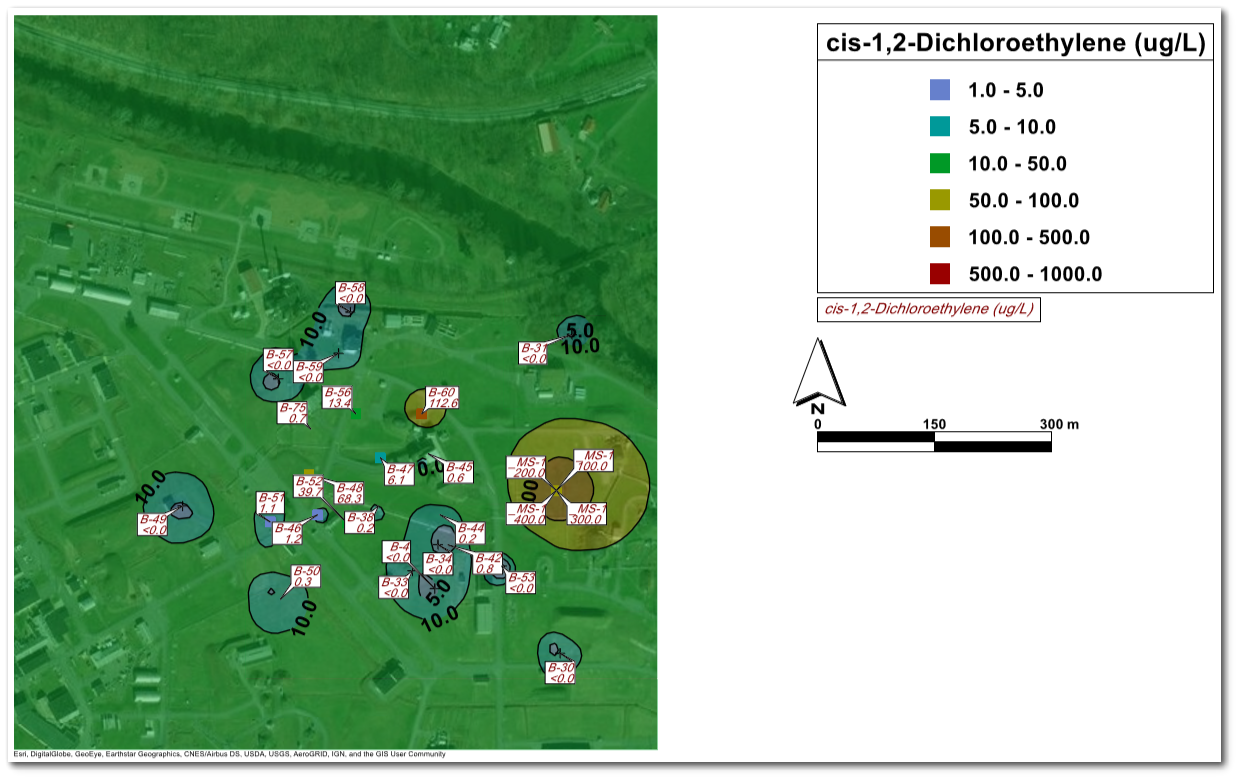
Description: The EnviroInsite Analyte Concentration Map report generates map reports that are intended to describe the bounds of a contaminant plume and exports the generated graphics to a vector or raster image file.
Installation Instructions: See the EnviroInsite Report Installation article for more detailed information.
For EQuIS Professional, a local installation of EQuIS EnviroInsite 7 is required to run the report.
Note: Using versions of EnviroInsite and Professional on the same machine that are not aligned can produce an 'evaluation' version of the report output. This occurs when using: •A version of EnviroInsite >7.23.2 and a version of Professional <7.23.2 •A version of EnviroInsite <7.23.3 and a version of Professional > 7.23.2 |
For EQuIS Enterprise, additional files must be added to the Enterprise bin folder. The required files are packaged (EnviroInsite_Enterprise_package_x64_{#}.zip) and available on the EarthSoft Community Center Downloads page (All Items\Products\EnviroInsite\v7). An EnviroInsite Decision Support license must be present as a valid entry in the ST_LICENSE table.
Overview:
The mapped results depend on the queried results of DT_SAMPLE, DT_TEST, and DT_RESULT. The plume contents may contain the following elements:
1.Contours – Isocontours are drawn based on values from the measured analyte concentration values that are interpolated onto points on a rectangular grid. These contours may be either simple lines or with fill between the drawn lines.
2.Symbol Plots – Measured analyte concentrations are represented using symbols that are color-coded to indicate the concentration at the symbol location.
3.Posted Values – Location names (SYS_LOC_CODE) and average analyte concentrations are posted within boxes connected by a leader to the sample locations.
4.Basemap – For no map display, specify 'None'. The basemap styles below are available, drawn from online map or photo image sources. Visit linked sites for details.
•Azure Maps
oAzure Maps Dark
oAzure Maps Imagery (Aerial Photo)
•Imagery (ArcGIS Aerial Photo)
•Street Map (ArcGIS Map)
•Topographic (ArcGIS Topo)
The base map boundaries (minimum and maximum northing and easting values) are initialized using the values of DT_FACILITY.X_MIN, DT_FACILITY.X_MAX, DT_FACILITY.Y_MIN, and DT_FACILITY.Y_MAX. If these DT_FACILITY fields are not populated, then the values are based on DT_COORDINATE.X_COORD and DT_COORDINATE.Y_COORD. If the values are in a latitude-longitude coordinate system, they will be converted to the display coordinate system.
EnviroInsite determines the coordinate system recorded in the DT_COORDINATES table based on the value in the EQuIS data fields DT_FACILITY.COORD_TYPE and the associated record in RT_COORD_TYPE.SRID.
•An SRID value of 4326 in the RT_COORD table indicates that the coordinate values are in latitude-longitude coordinates. In that case, the display coordinates will be in UTM, within the UTM zone at the center of the extent of the location positions.
•SRID values starting with 326 are presumed to indicate UTM coordinates within the northern hemisphere. SRID values starting with 327 are presumed to indicate UTM coordinates within the southern hemisphere. The final two digits in either of these cases are taken to be the UTM longitudinal zone. For example, an SRID value of 32617 would represent UTM longitudinal zone 17 in the northern hemisphere. State plane coordinates are not supported at this time.
•Other SRID values for MTM, State Plane, or Spherical Mercator coordinates are not presently supported.
All maps are displayed in UTM coordinates.
This report may also be run from an EZView widget in EQuIS Enterprise. To run in the widget, the report needs to be published from EQuIS Professional for the database to be accessed from EQuIS Enterprise. Other supporting DLL files that must be present in the bin folder are listed below under Report Requirements.
Input Parameters: The following parameters may be selected from the standard EQuIS parameter selection interface. Readers are referred to the EnviroInsite documentation for more information on document properties and the properties of plotted objects.
Report Parameters |
||||||||||||||||||||||||||||||||||||||||||||||||||||||||||||||||||||||||||||||||||||||||||||||||||||||||||||||||||||||||||||||||||||
|---|---|---|---|---|---|---|---|---|---|---|---|---|---|---|---|---|---|---|---|---|---|---|---|---|---|---|---|---|---|---|---|---|---|---|---|---|---|---|---|---|---|---|---|---|---|---|---|---|---|---|---|---|---|---|---|---|---|---|---|---|---|---|---|---|---|---|---|---|---|---|---|---|---|---|---|---|---|---|---|---|---|---|---|---|---|---|---|---|---|---|---|---|---|---|---|---|---|---|---|---|---|---|---|---|---|---|---|---|---|---|---|---|---|---|---|---|---|---|---|---|---|---|---|---|---|---|---|---|---|---|---|---|
|
Troubleshooting: If only a basemap is in the export when running the EnviroInsite Analyte Concentration Map report, the cause may be no data being selected or a mismatch between saved parameters and DT_FACILITY.COORD_TYPE_CODE. Please check the parameter selections and try again.
Copyright © 2026 EarthSoft, Inc. • Modified: 13 Oct 2024