Historical water level data can be exported from the EQuIS database for use in the History:DTW tab (a.k.a. "Historical Depth to Water" tab) in EDGE. The following steps explain how to export these data and view them in EDGE:
1.In EQuIS Professional or EQuIS Enterprise, open an EDGE Field EDD Report, as explained in EDGE Field EDD - Standard with EDGE or SPM Purchase.
Note: If this report does not appear in the list of available reports, copy the EarthSoft.Reports.Library.40338.dll file found in the .\EDGE\Reports\ directory to either: •EQuIS Professional -- .\EarthSoft\EQuIS\ •EQuIS Enterprise -- .\EarthSoft\EQuIS Enterprise\bin\ -or- .\EarthSoft\Enterprise6\bin\ |
2.Select the desired parameters, including selections on the "Historical" group of input parameters such as these listed below.
•Years Back: define the time range for which water level data should be returned, e.g. 3 years back.
•Historical range outlier: This parameter dictates what percentage of outlier data should be removed from the export. It is set to 5% by default.
•Select field(s) to plot on the historical chart.
•Additional fields that should be exported to the data grid that accompanies the chart.
These selections may be made on water level, and any relevant LNAPL data. Activity data and well redevelopment data may also be exported.
3.Run the report to generate the EDGE Field EDD, which opens in Excel. You can navigate to the "EDGE_Historical" worksheet to confirm that the historical data were exported.
4.Save the file to a known location and close the file in Excel.
5.Open EDGE.
6.Check that the History: DTW tab is visible by using the Show/Hide Tabs option explained in Data Tab Chooser.
Note: If the Move Historical Tab option in Application Options (under User Interface) is enabled, the History:DTW tab will be automatically moved when a compatible tab is selected. History:DTW then becomes a sub-tab of that compatible tab. For example, selecting the Water Levels tab with this feature enabled will cause the History:DTW tab to move into a new, horizontal pane on that tab. |
7.Open the previously-generated EDD.
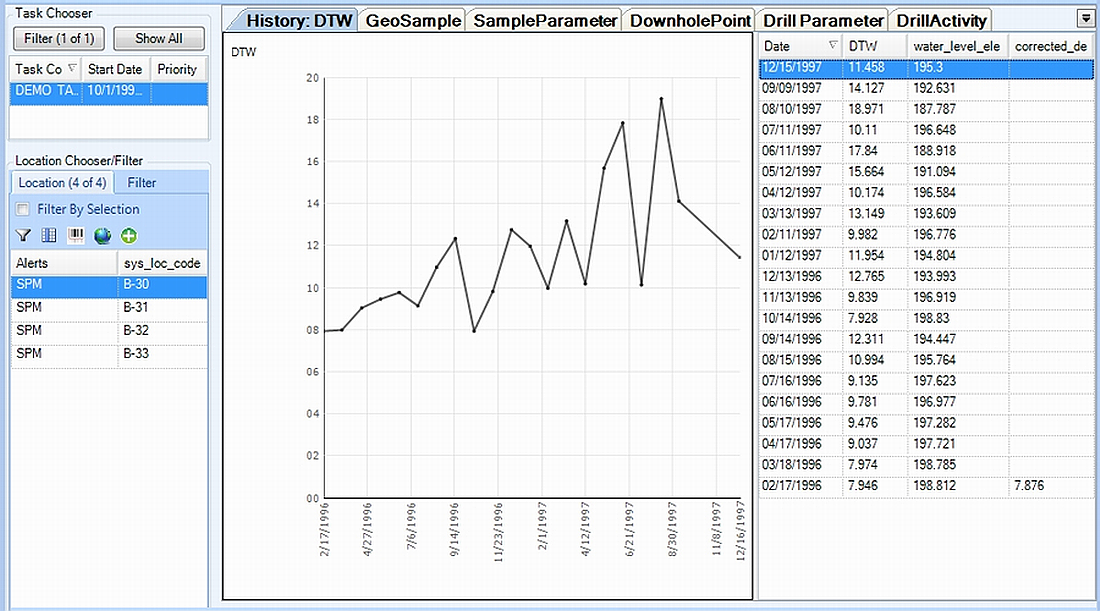
8.Select a location from the Location Chooser in the left pane of the screen.
9.Note that a chart is generated to the right of the data grid, with any additional fields that were selected for export.