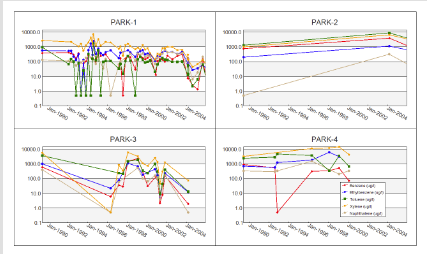
EnviroInsite allows for the generation of full page time series charts. These are similar in appearance and features to the georeferenced time series charts, but are presented as tiled objects on a page. The time series graphs can have multiple constituents, multiple wells, trend lines, and/or regulatory standards.
View a training video on creating time series charts in EnviroInsite here.
To create full page time series charts, select Window> New> Charts from a plan view map. A new view window is generated. Select Plot> Multi-analyte or Multi-well to open the Time Series Graph dialog box. Modify the graph properties on the Query tab, Line Format tab, Time Axis tab, Left Axis tab, Right Axis tab, Options tab, Format tab, Standards tab, and EQuIS Query tab as desired. Click the OK button to save changes.
When multiple charts appear while plotting Multi-Well and Multi-Analyte charts in EnviroInsite, the chart order is in alpha-numeric order based on the Constitute.
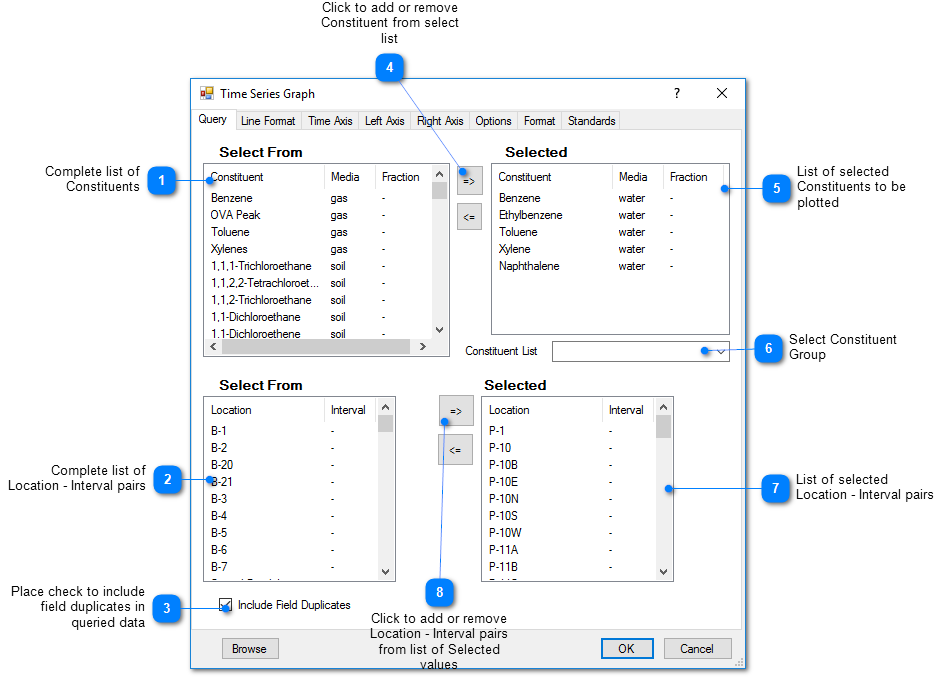
Query Tab
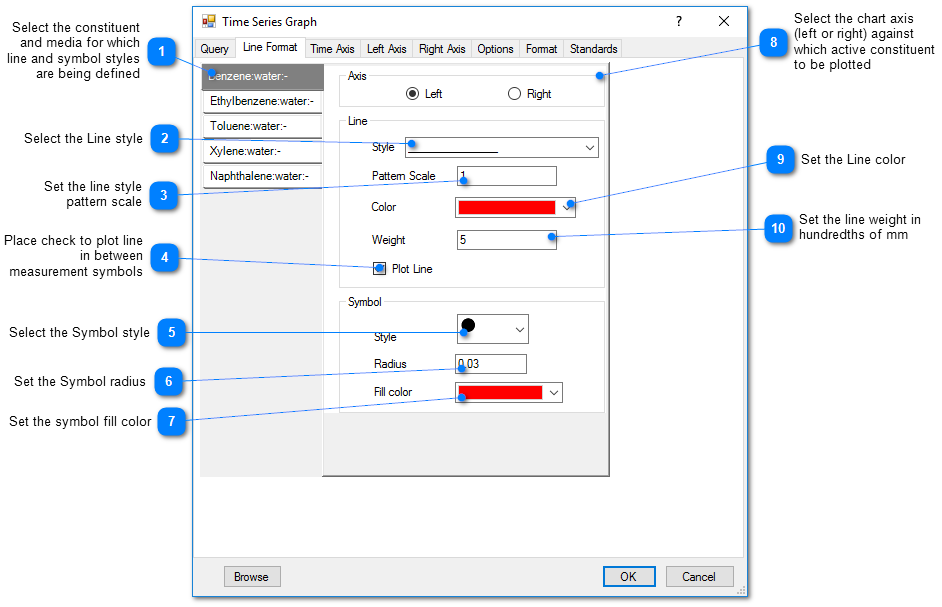
Line Format Tab
Options Tab
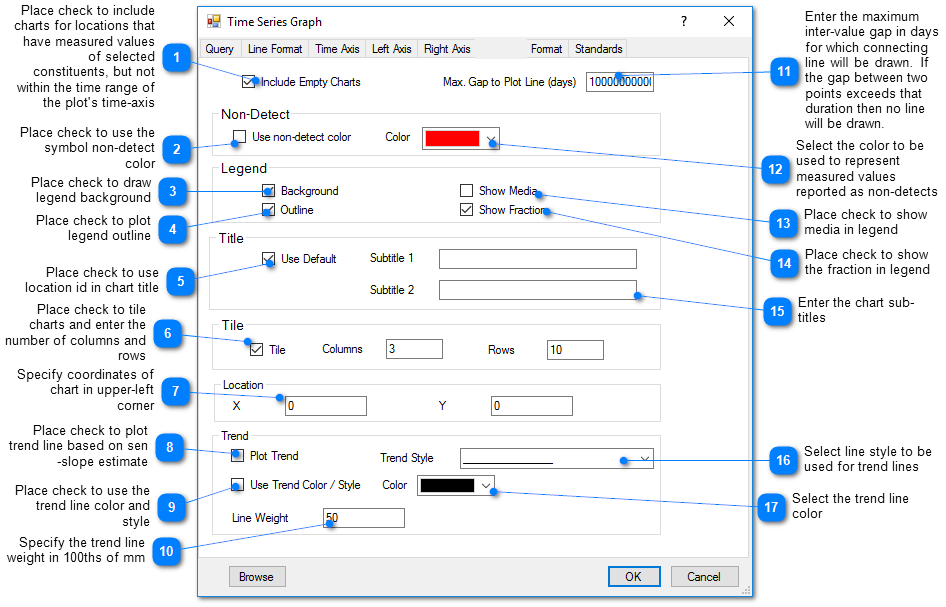
Max. Gap to Plot Line (Days) – Indicate the maximum inter-value gap in days for which a connecting line will be drawn. If the gap between two points exceeds that duration then no line will be drawn.
Trend – EnviroInsite uses the Sen Slope method described in EPA/240/B-06/003 for plotting of trend lines. The Sen Slope is a non-parametric method calculated as the median of the slope between all measurement pairs. The trend line is set to pass through a point set to the median of the sample dates and the median of the plotted values.